Hyperglobalization Undermines Response to COVID-19 Crisis
U.S. Trade Deficits in Ventilators, Masks, and Other PPE Increase and Shortages Reemerge, Reflecting U.S. Overreliance on Imported Goods to Battle COVID-19
Trade Data Shows Significant U.S. Dependence on India and China for Key Medicines
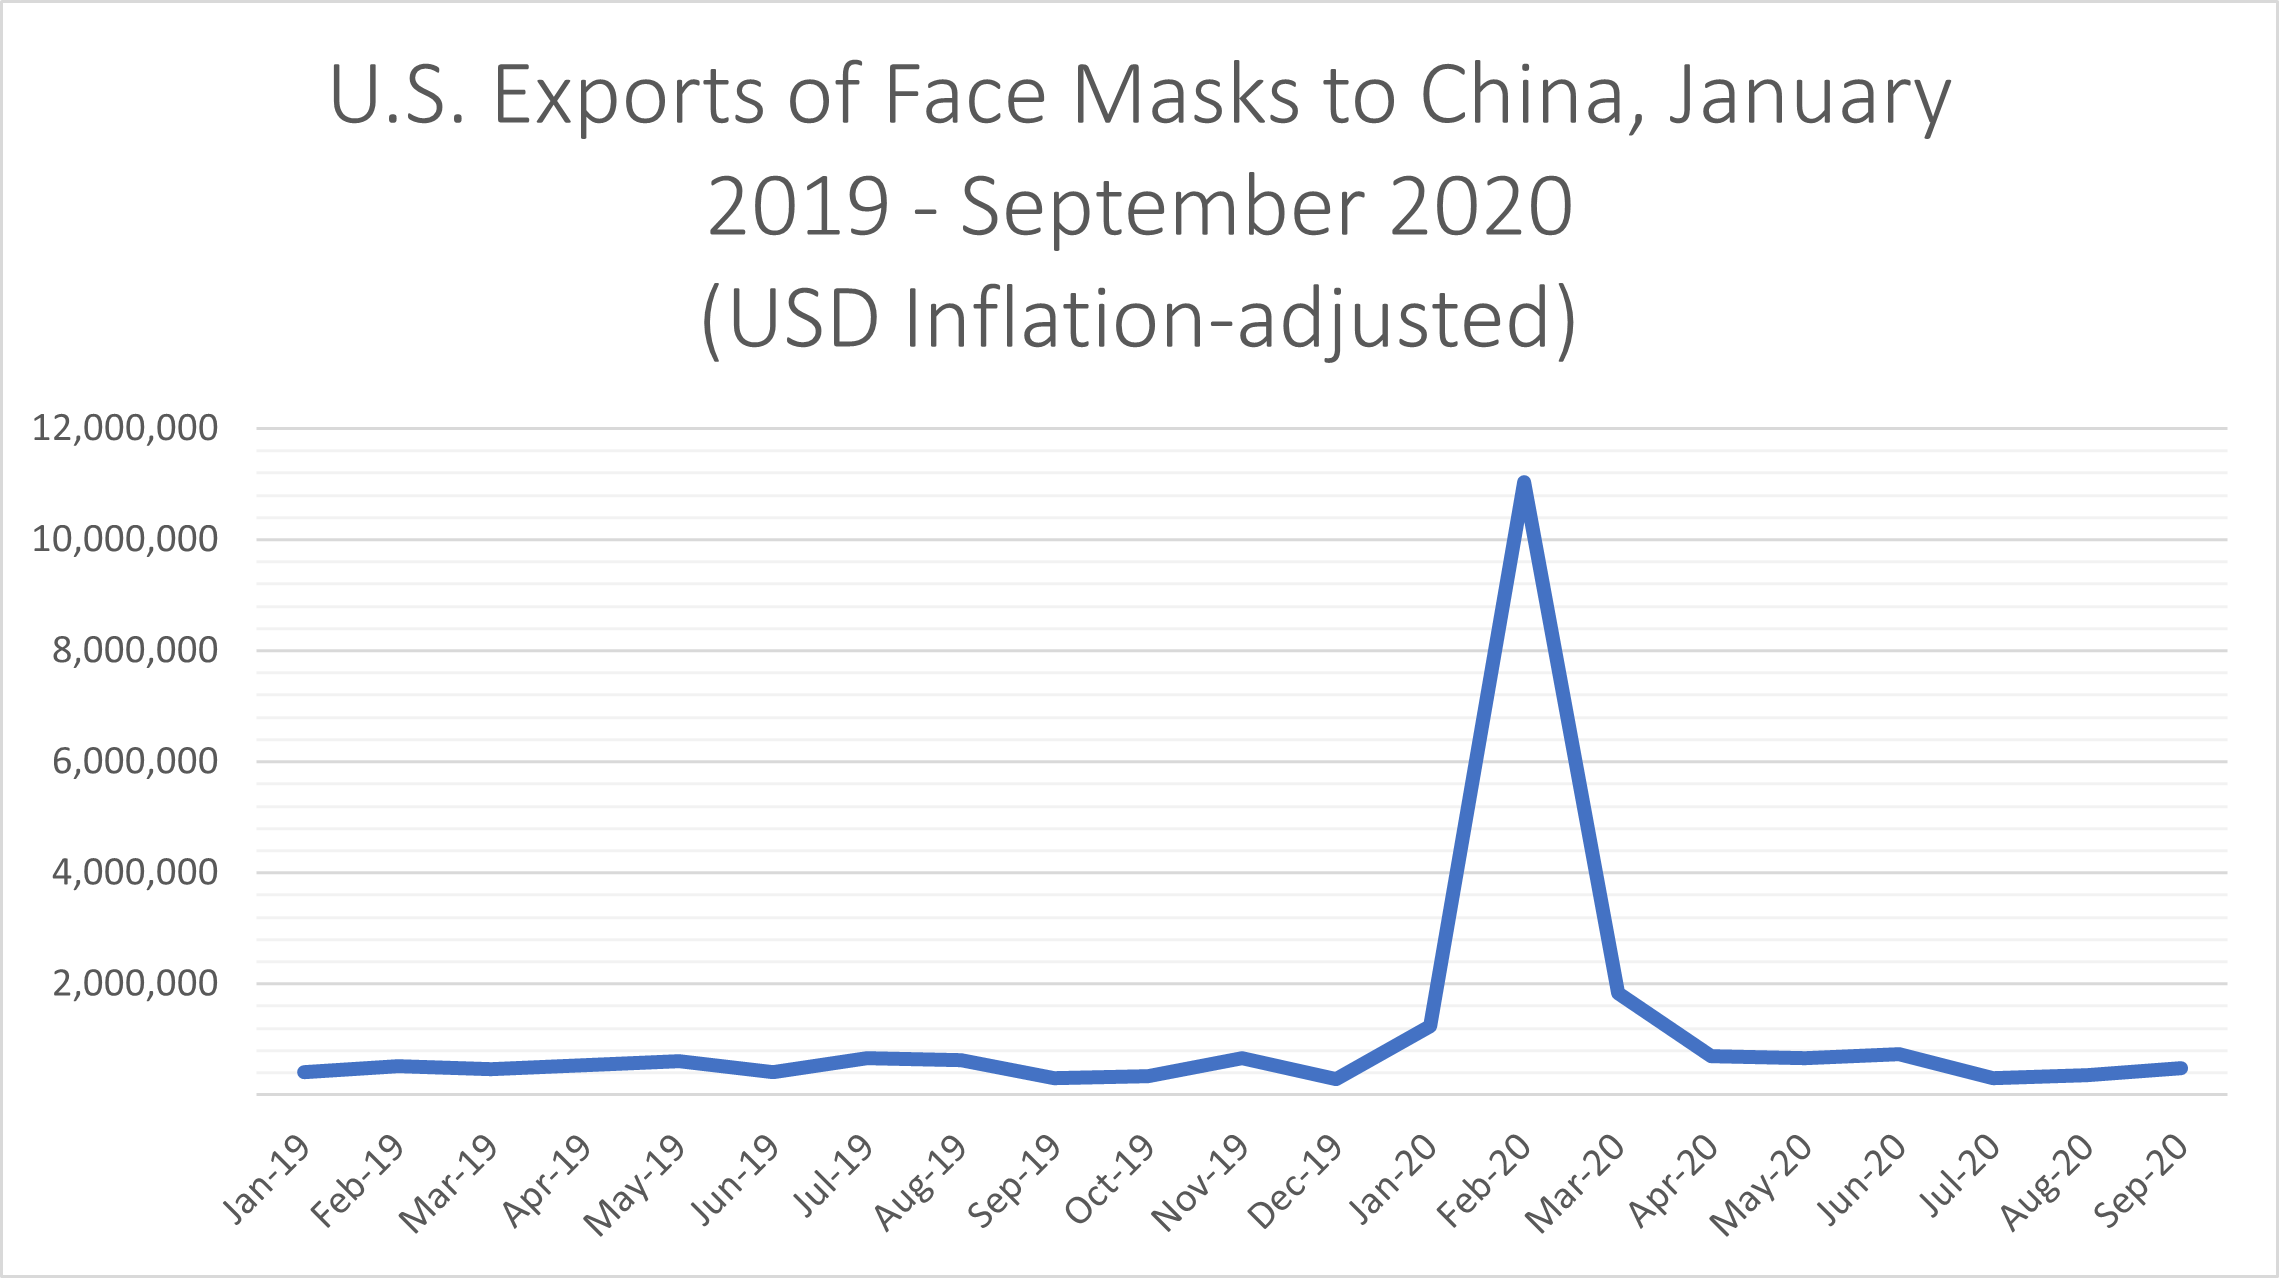
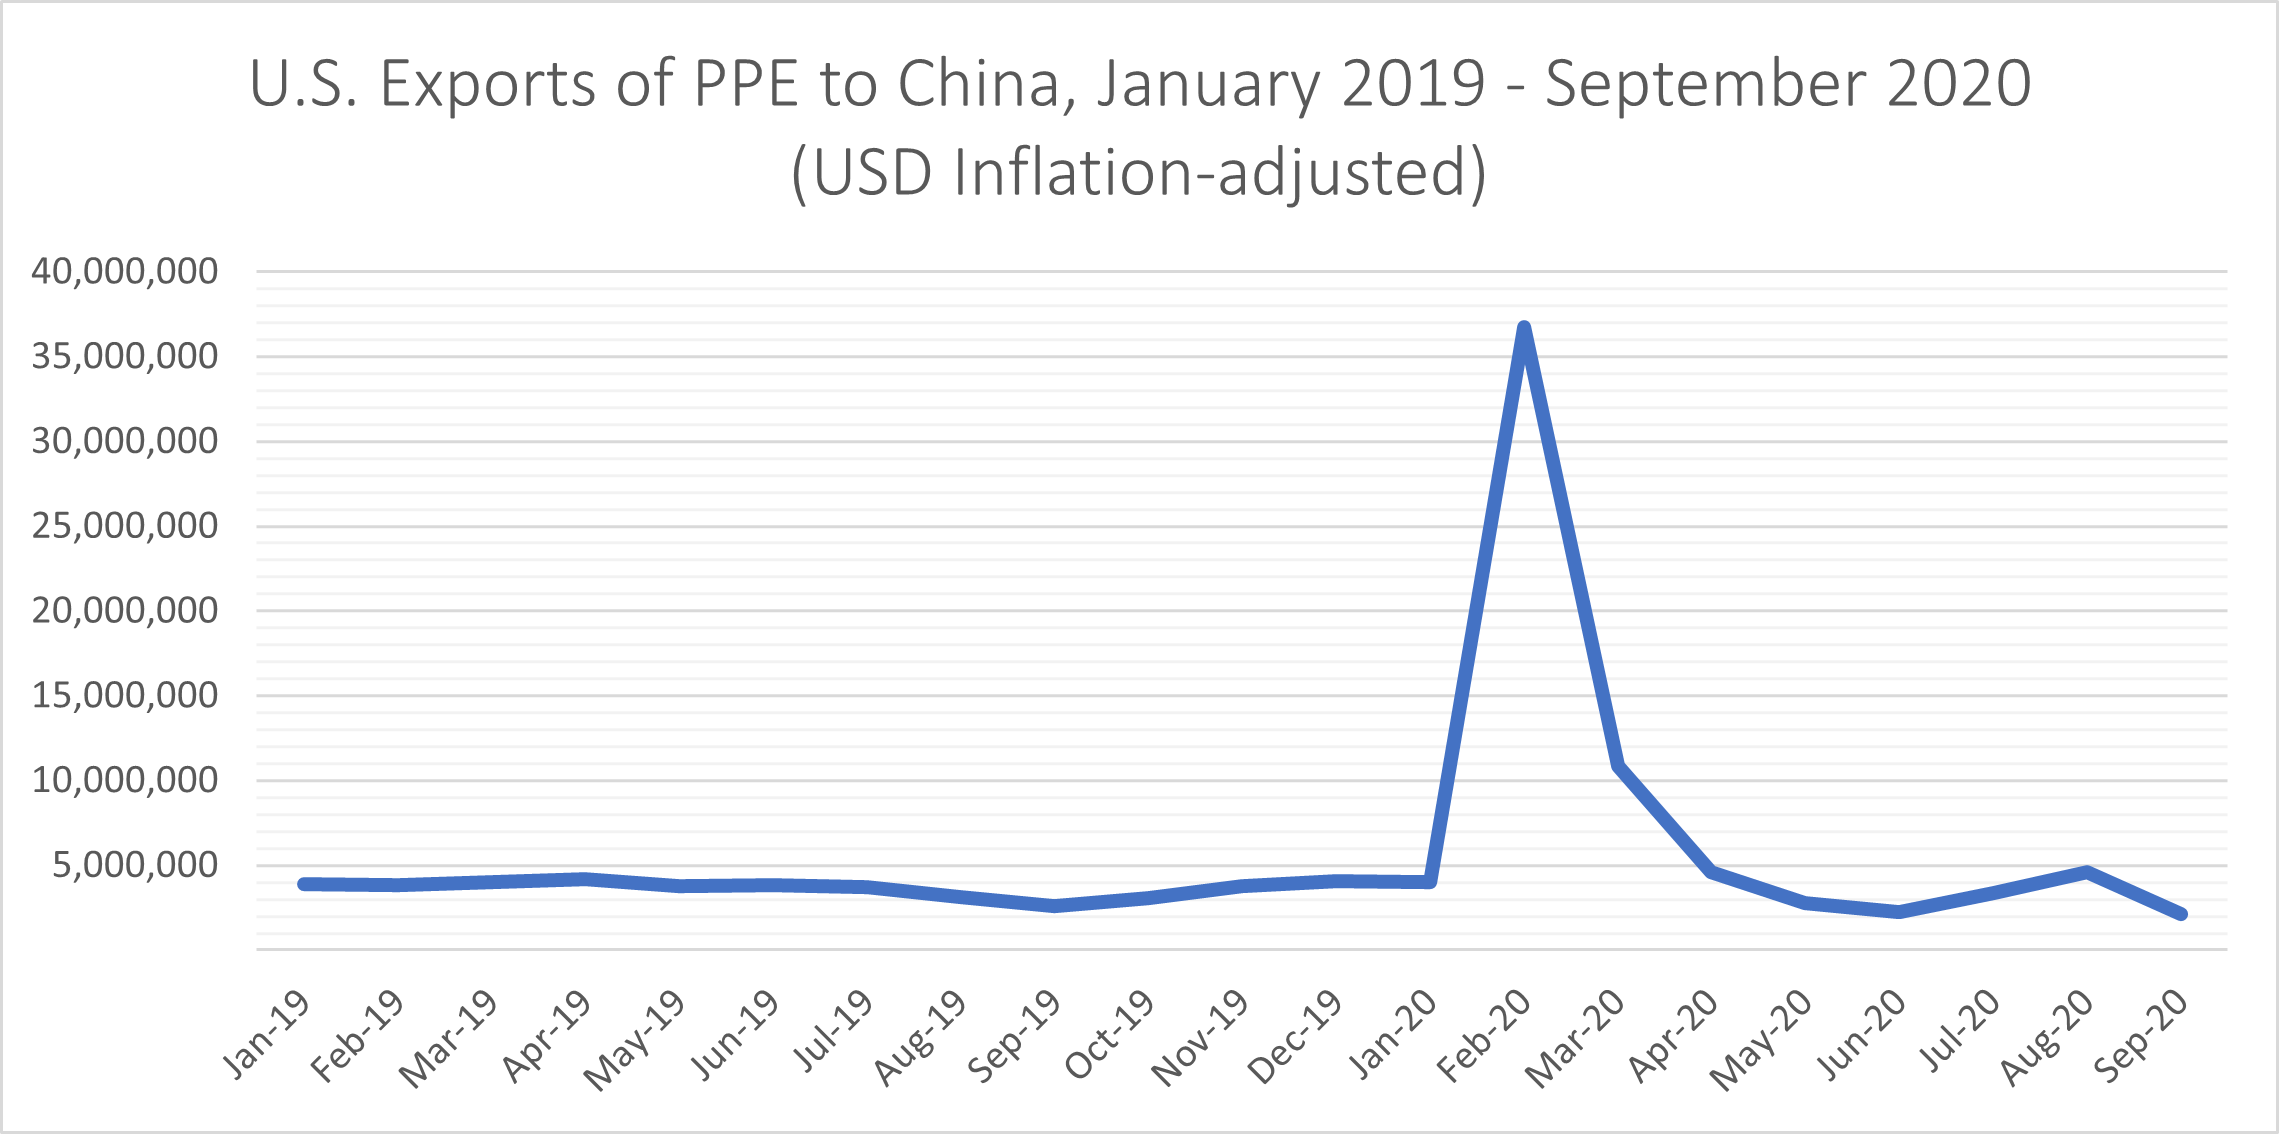
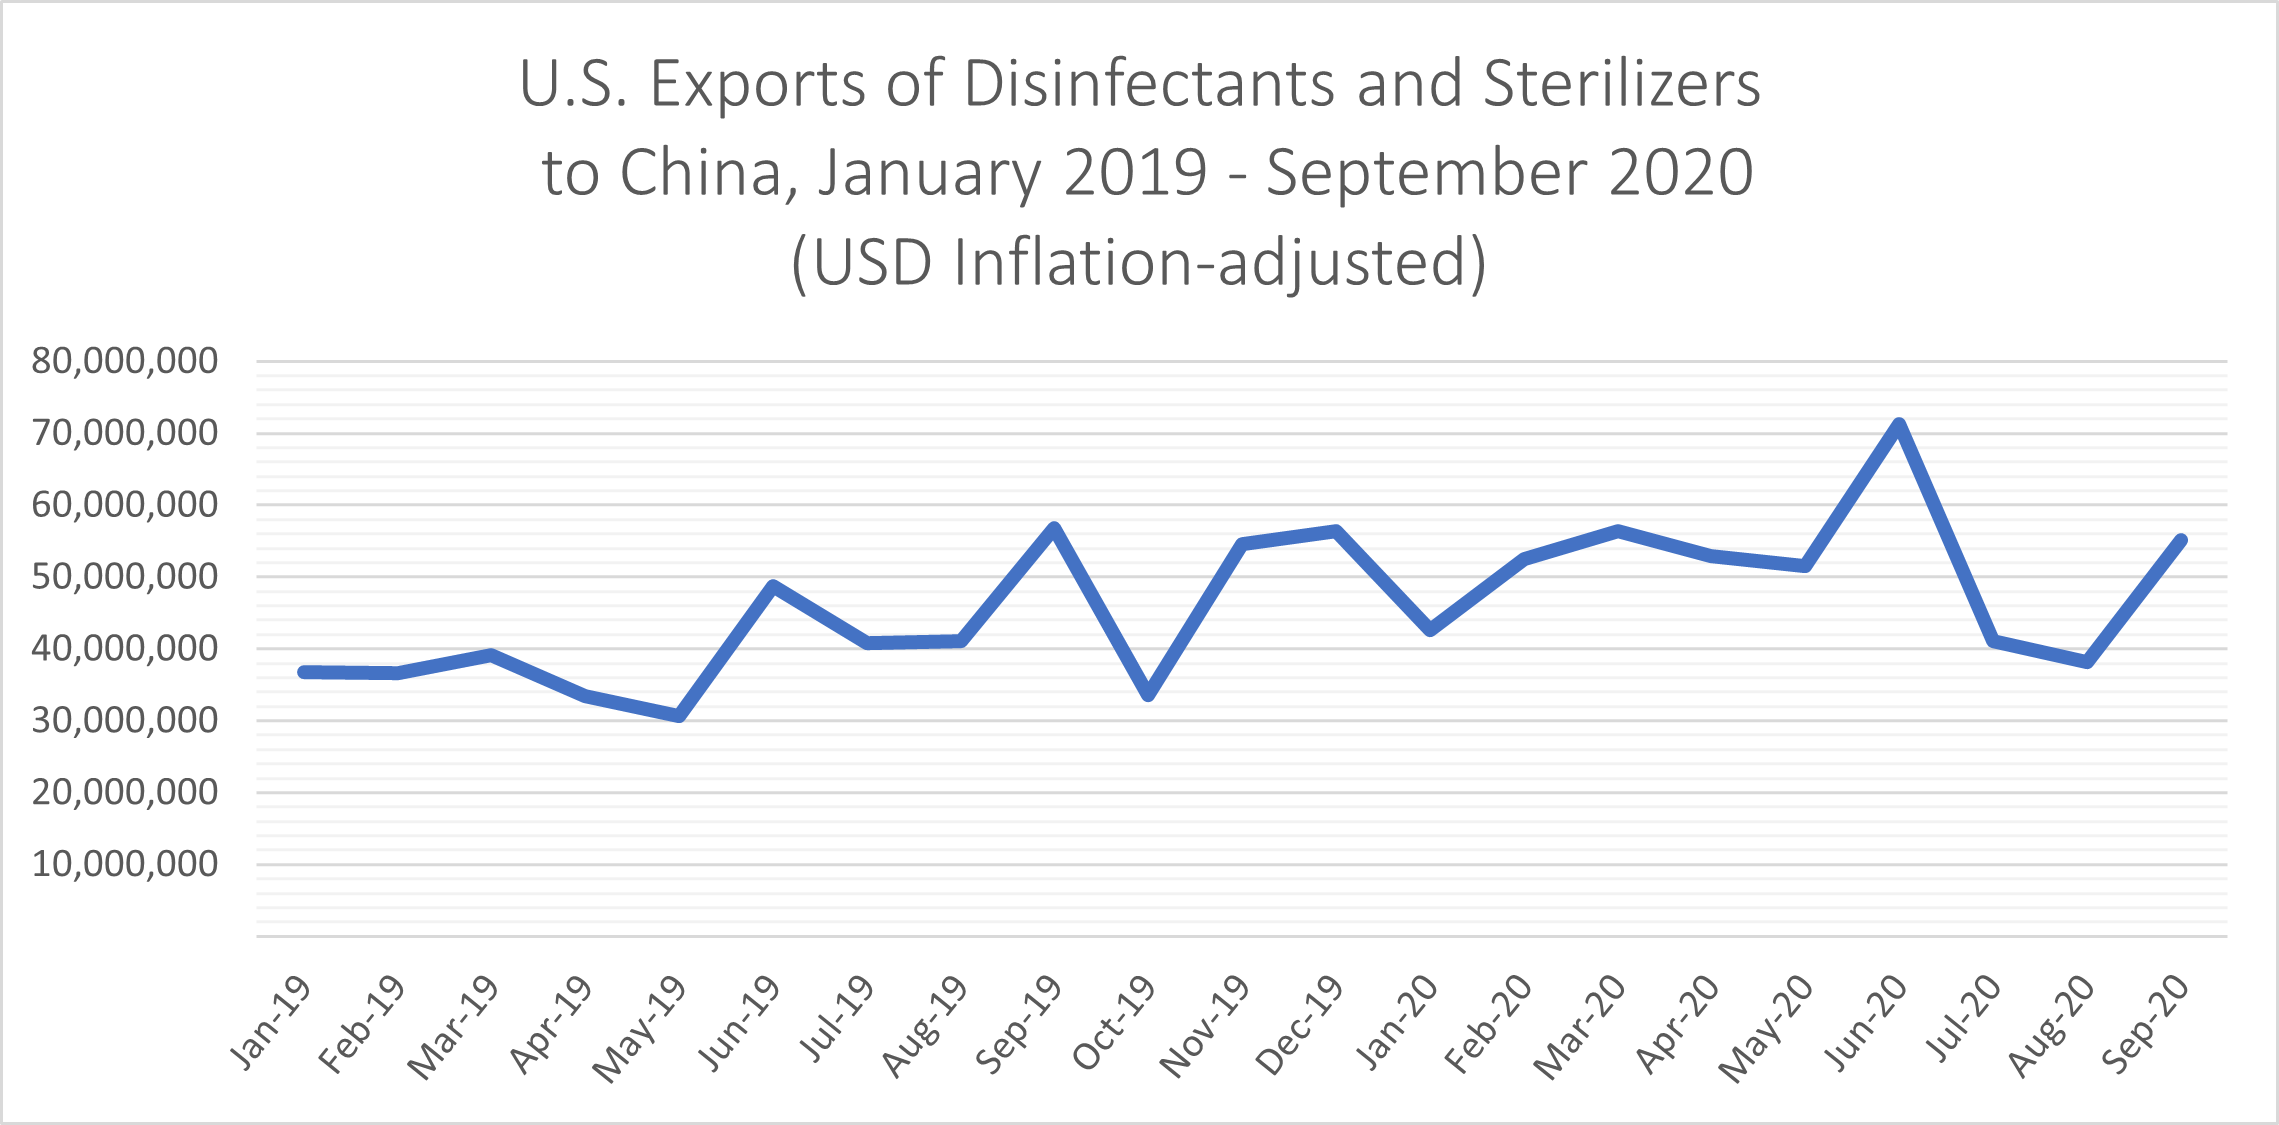
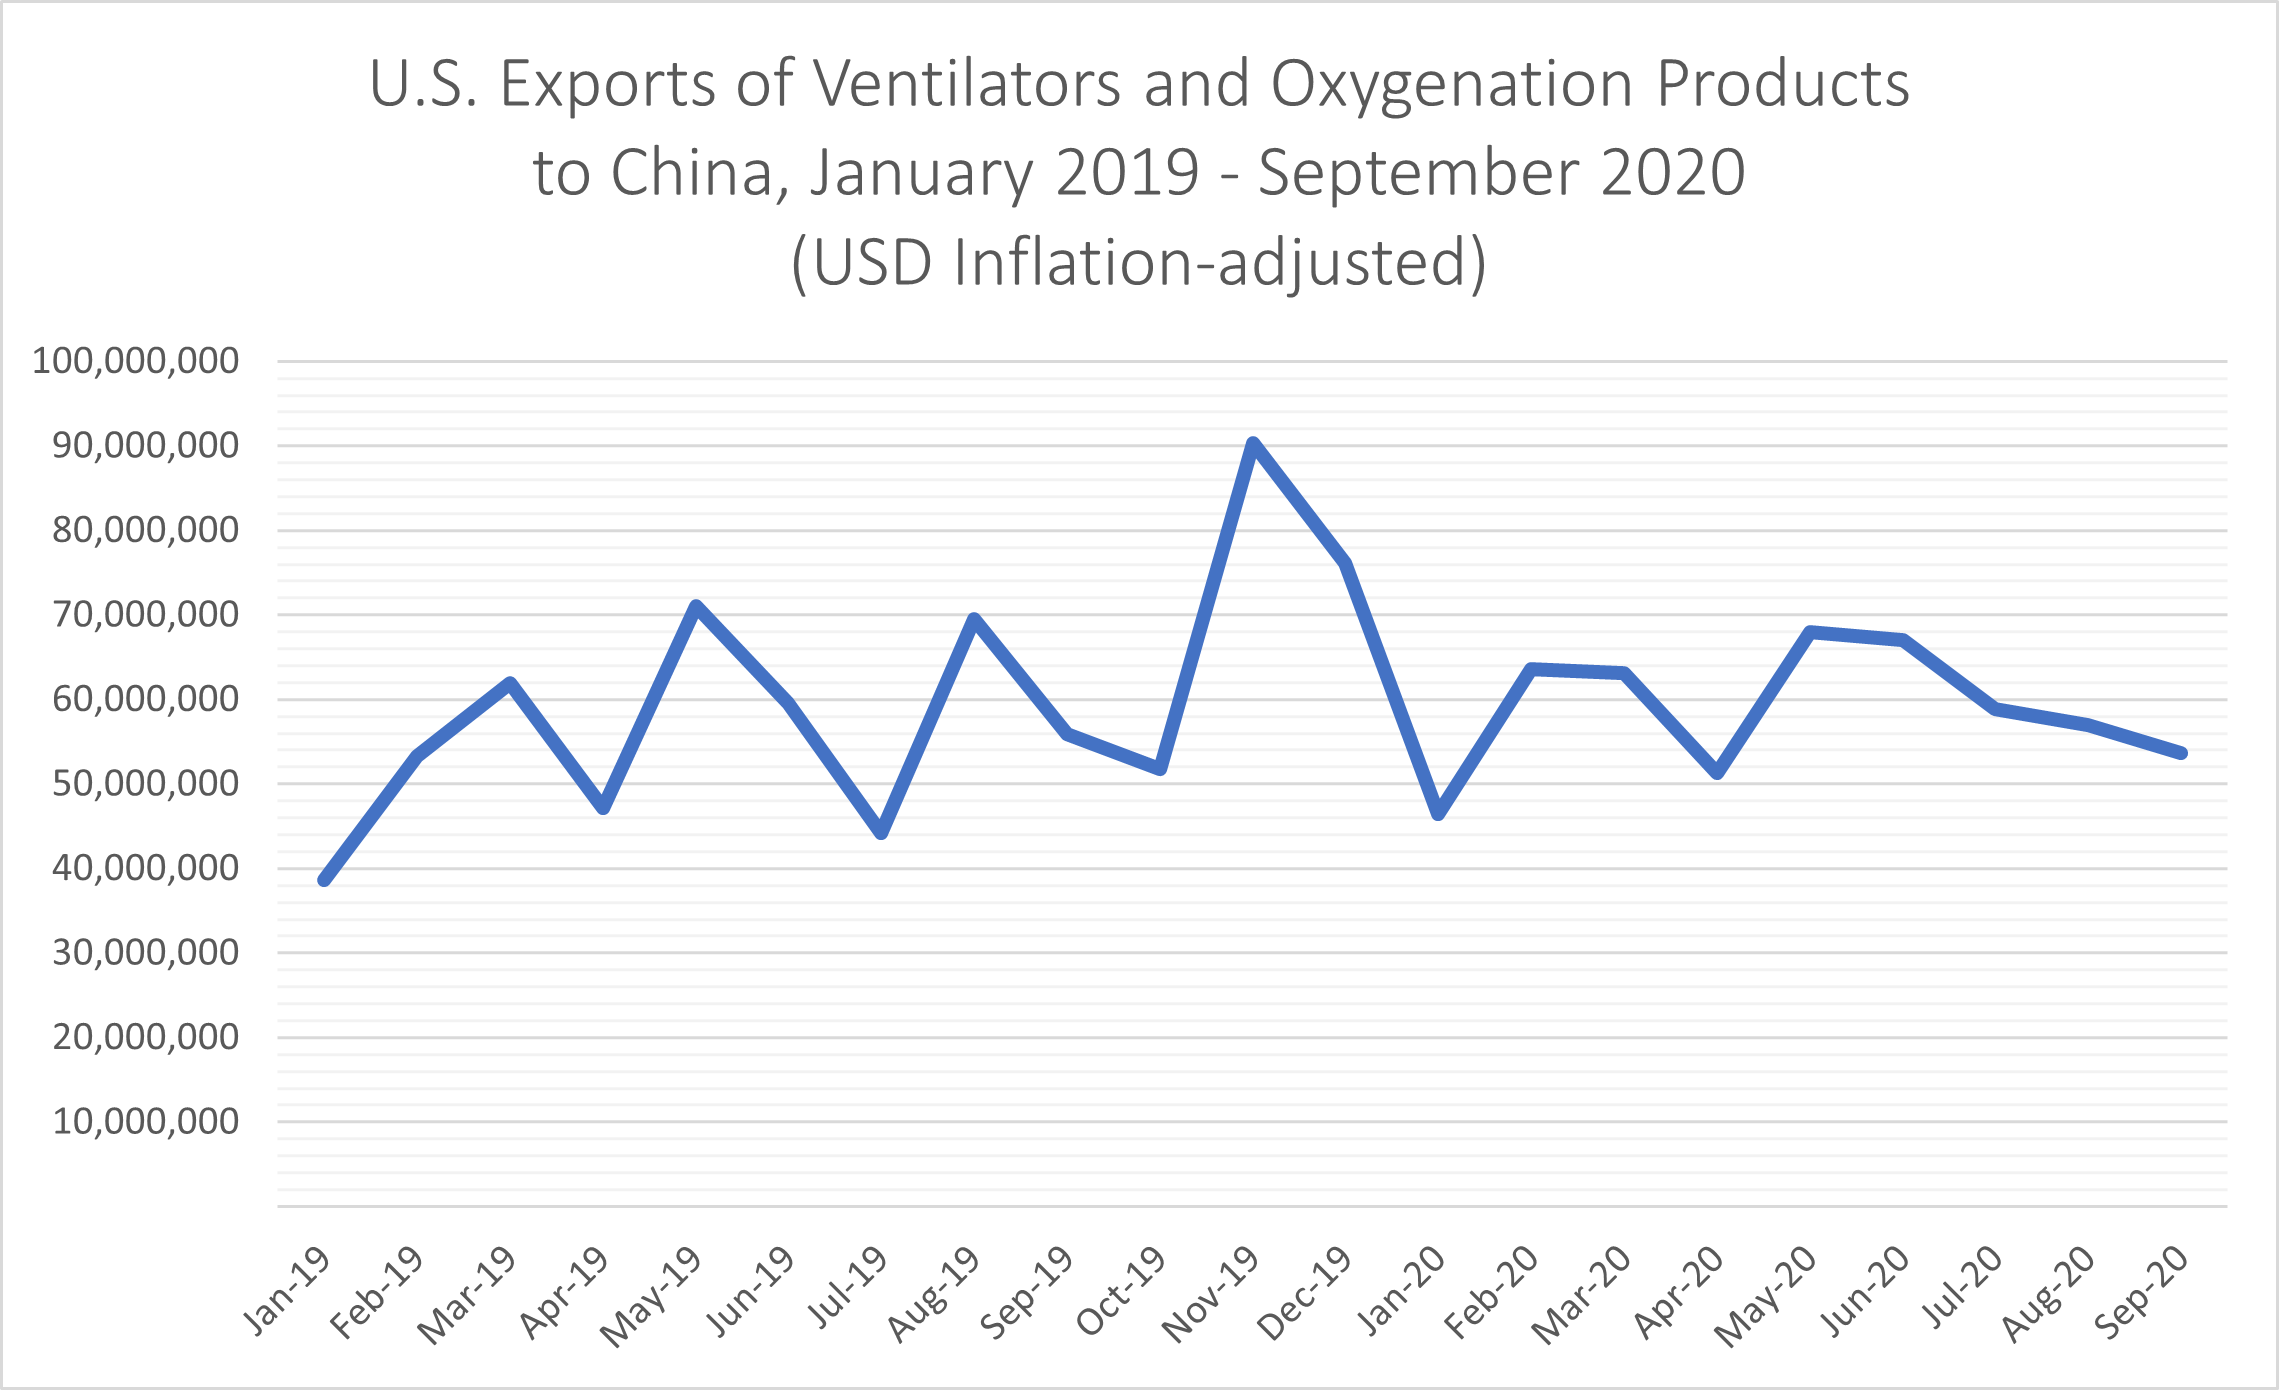
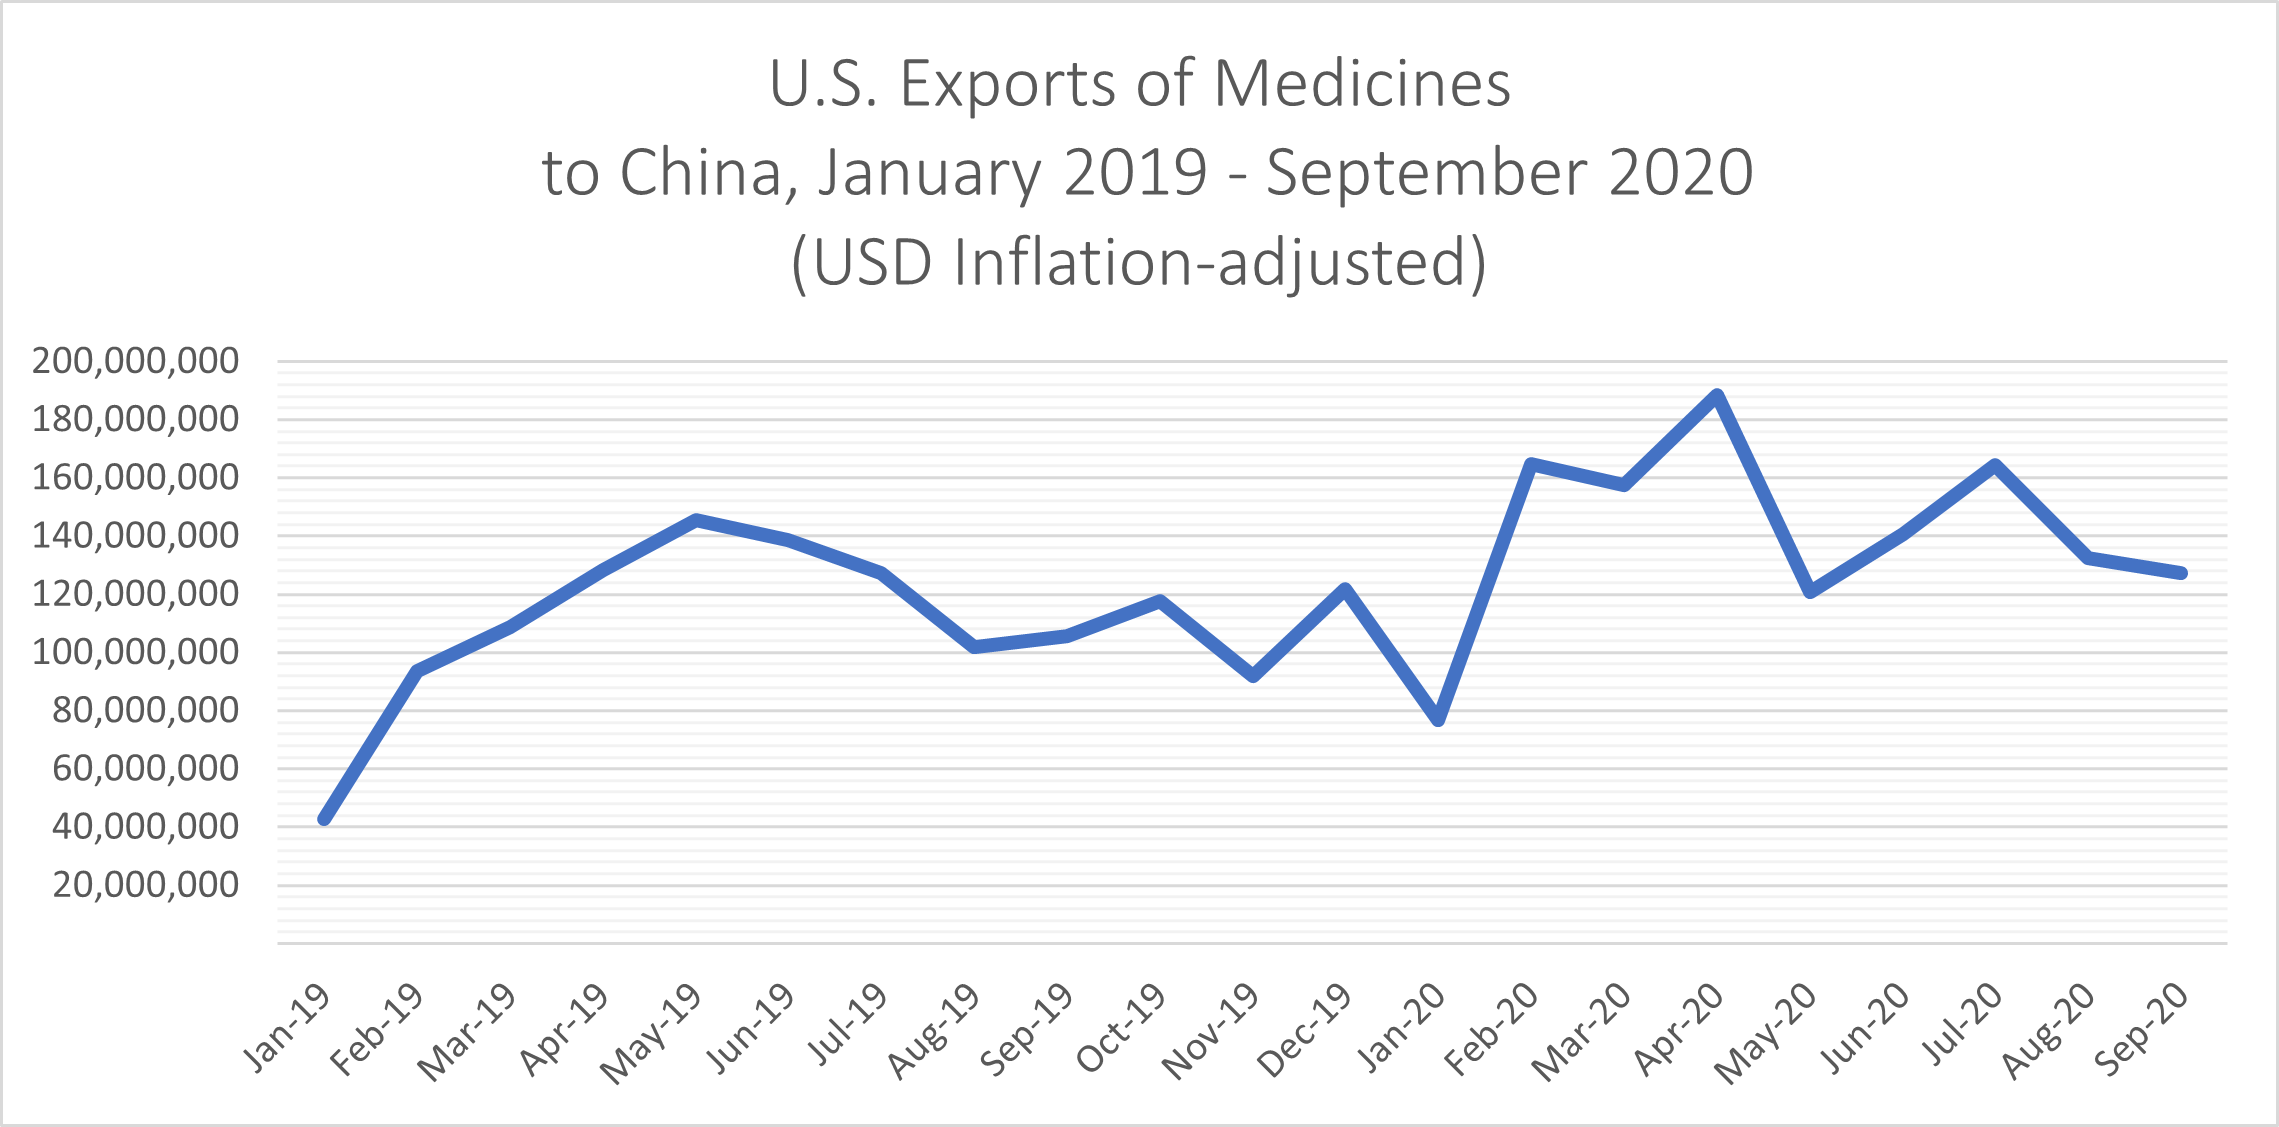
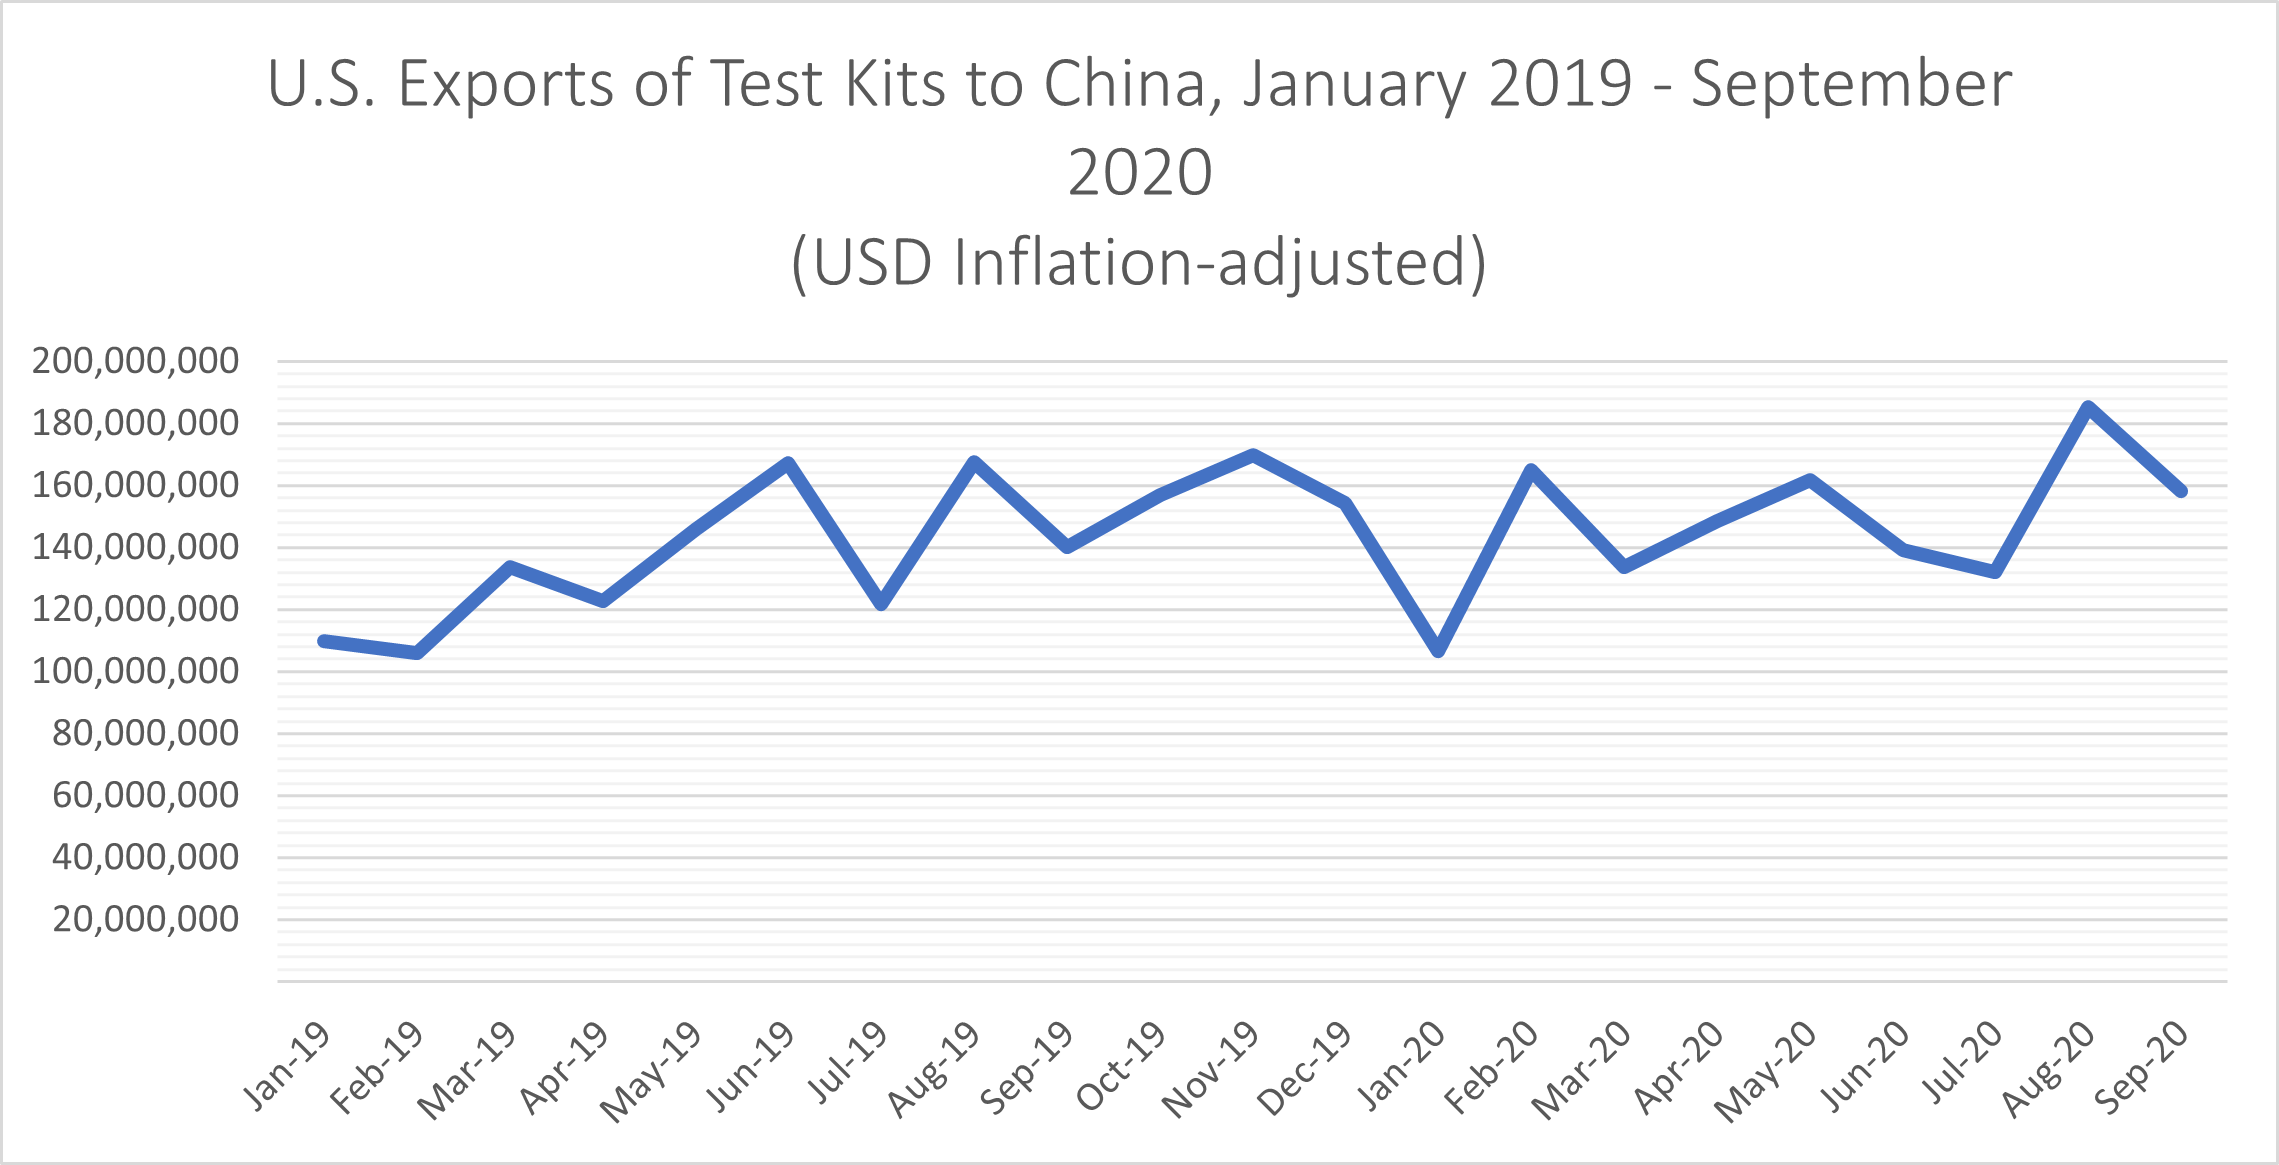
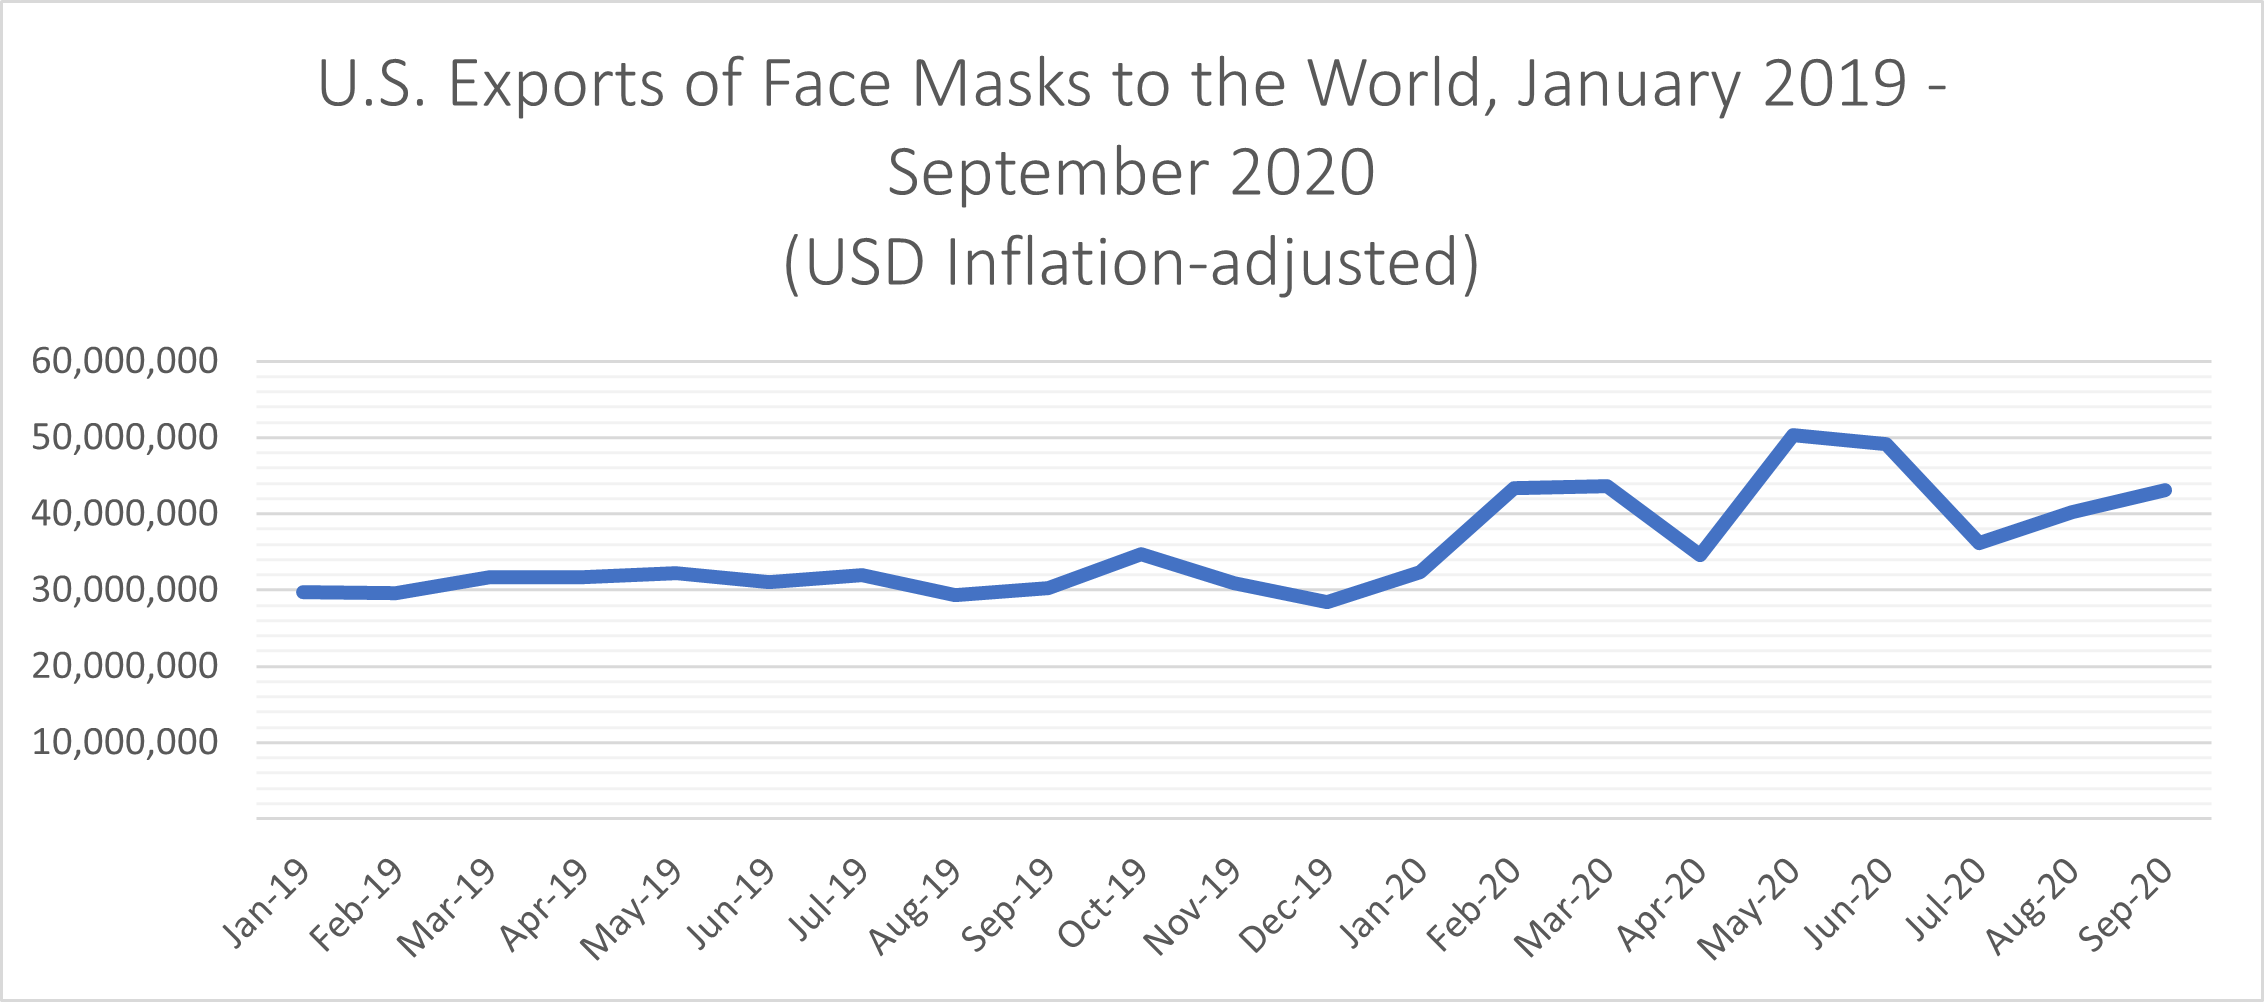
U.S. Global Exports of Face Masks Continued to Rise into Summer 2020, after U.S. Exports to China of Medicines, Masks, Disinfectants, and Gloves Spiked between January-April 2020
Decades of hyperglobalization have undermined our resilience against the COVID-19 crisis. Even into fall 2020, the United States still cannot make or get critical goods people need with growing shortages of Personal Protective Equipment (PPE) as infection rates rise again. More than 60,000 U.S. manufacturing facilities have been lost to 26 years of corporate-rigged trade policies that made it easier and less risky to move production overseas to pay workers less and trash the environment.
The infographics below show:
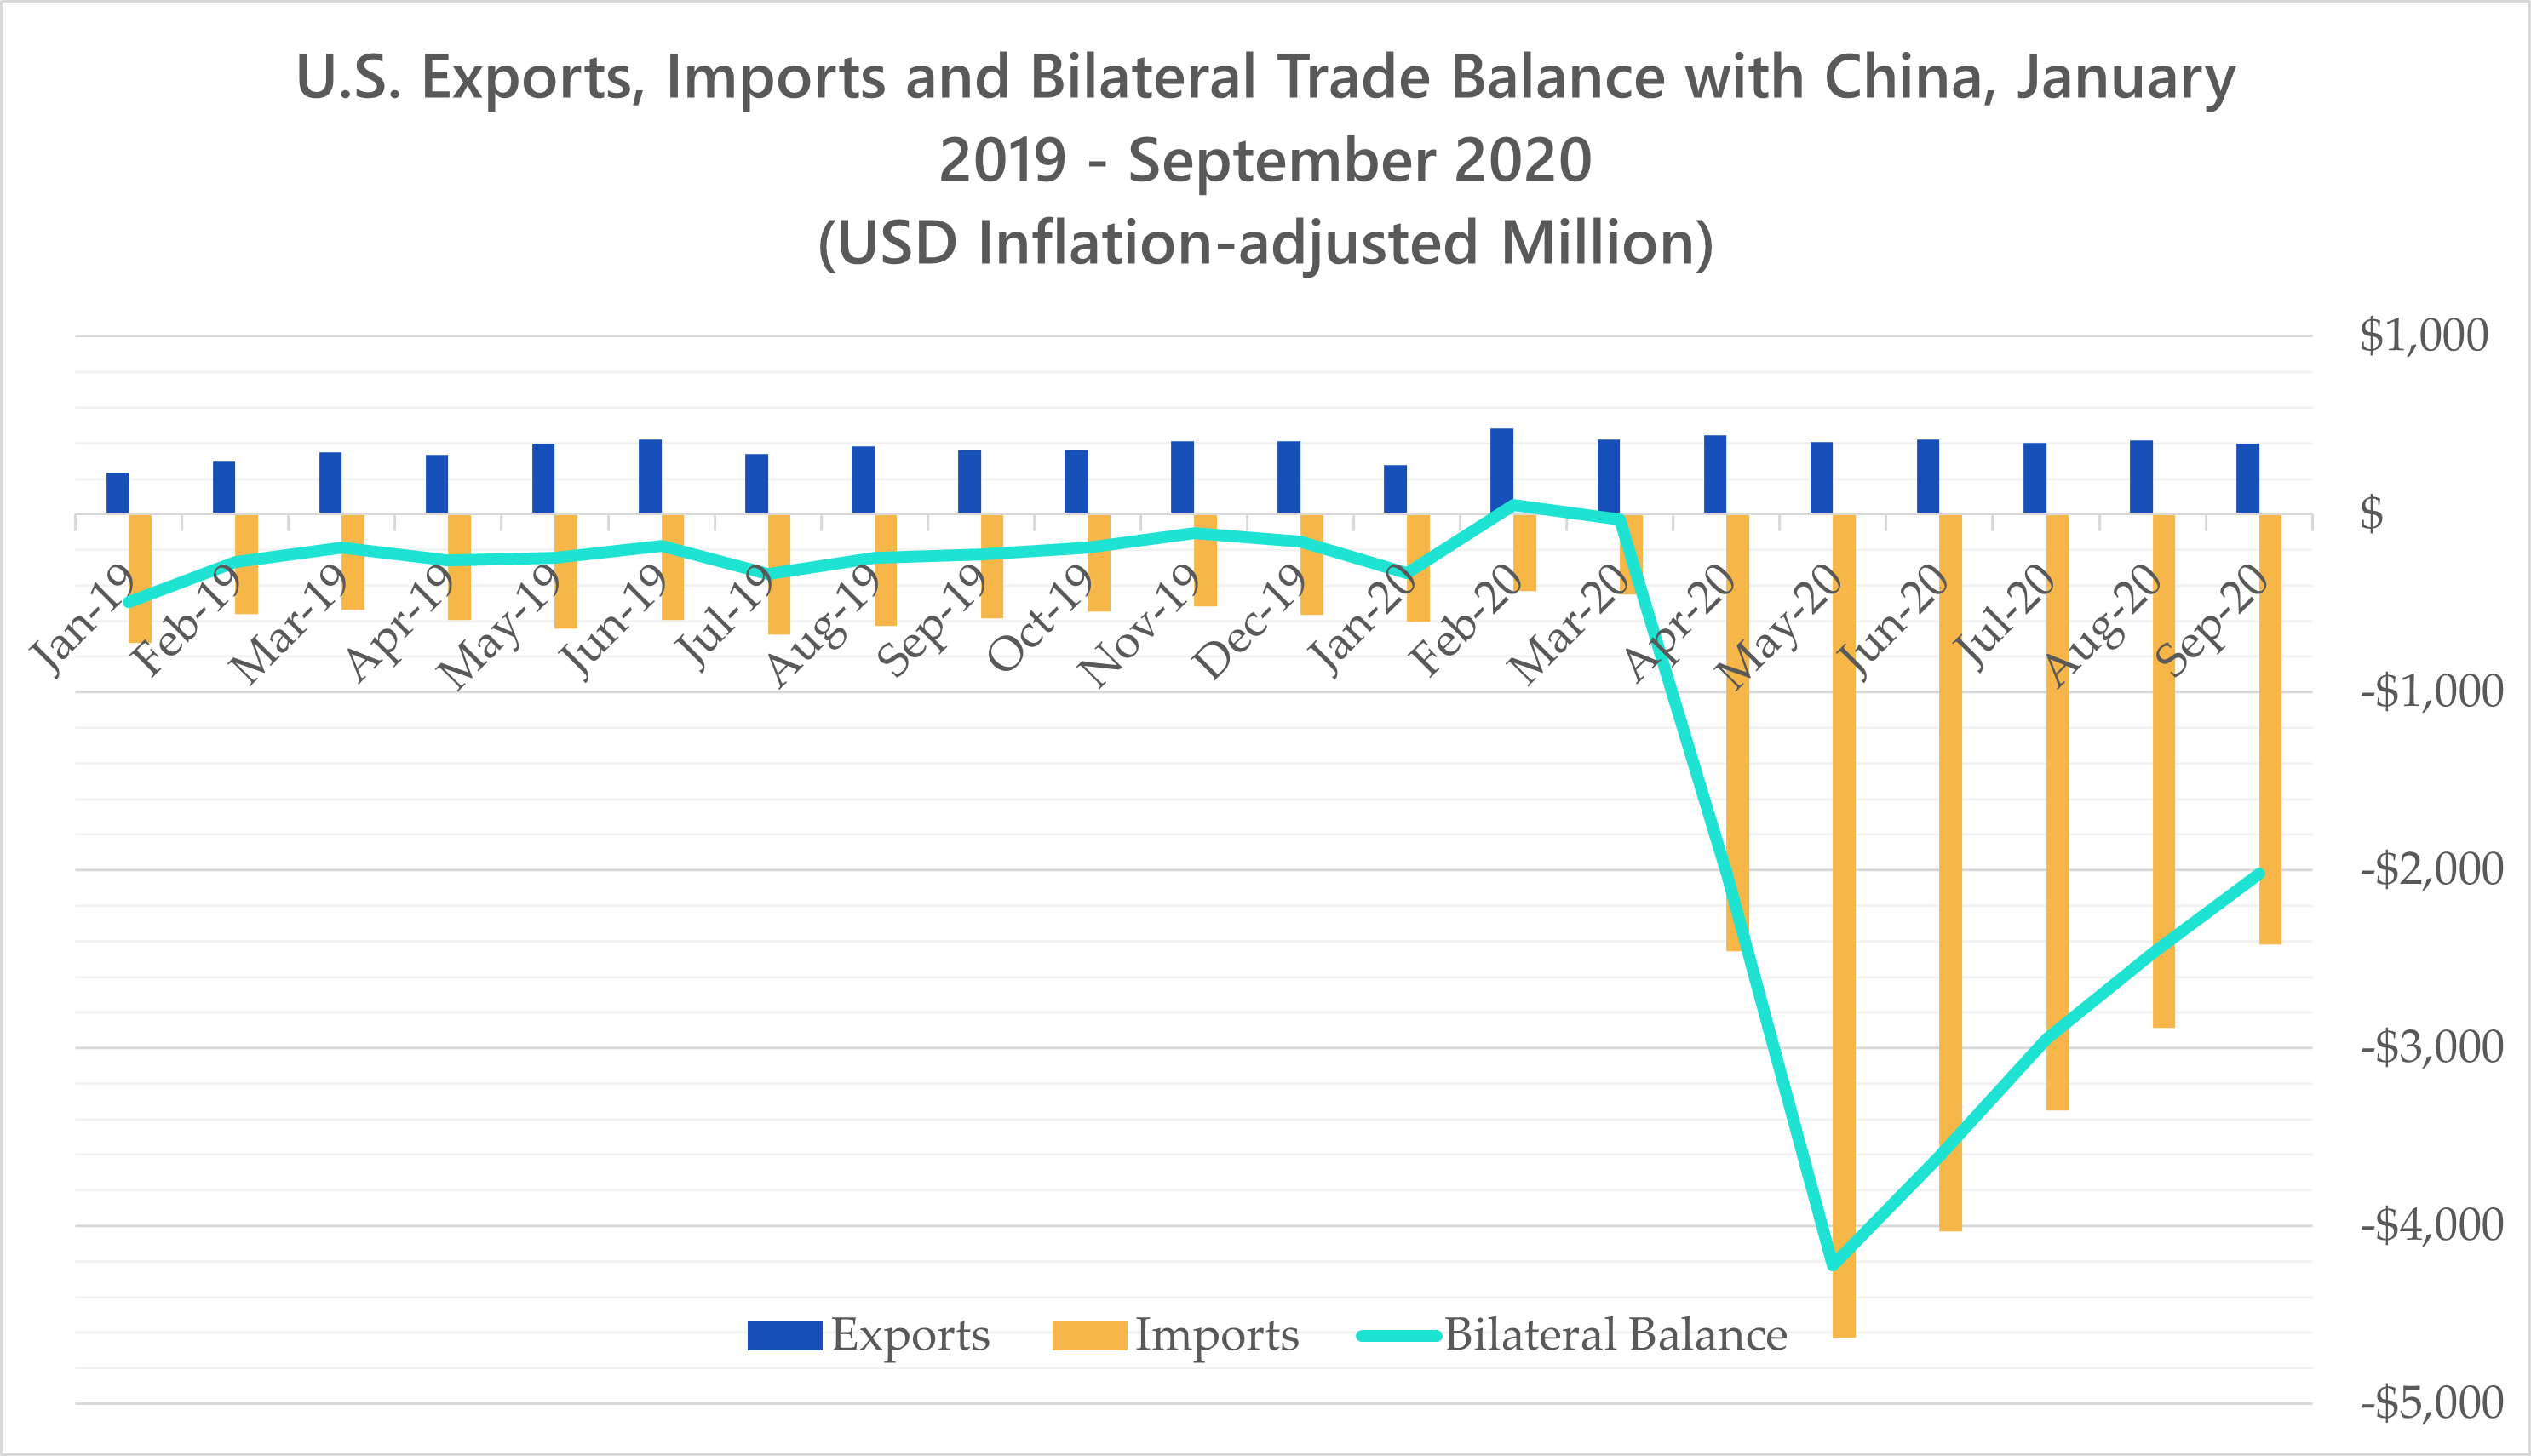
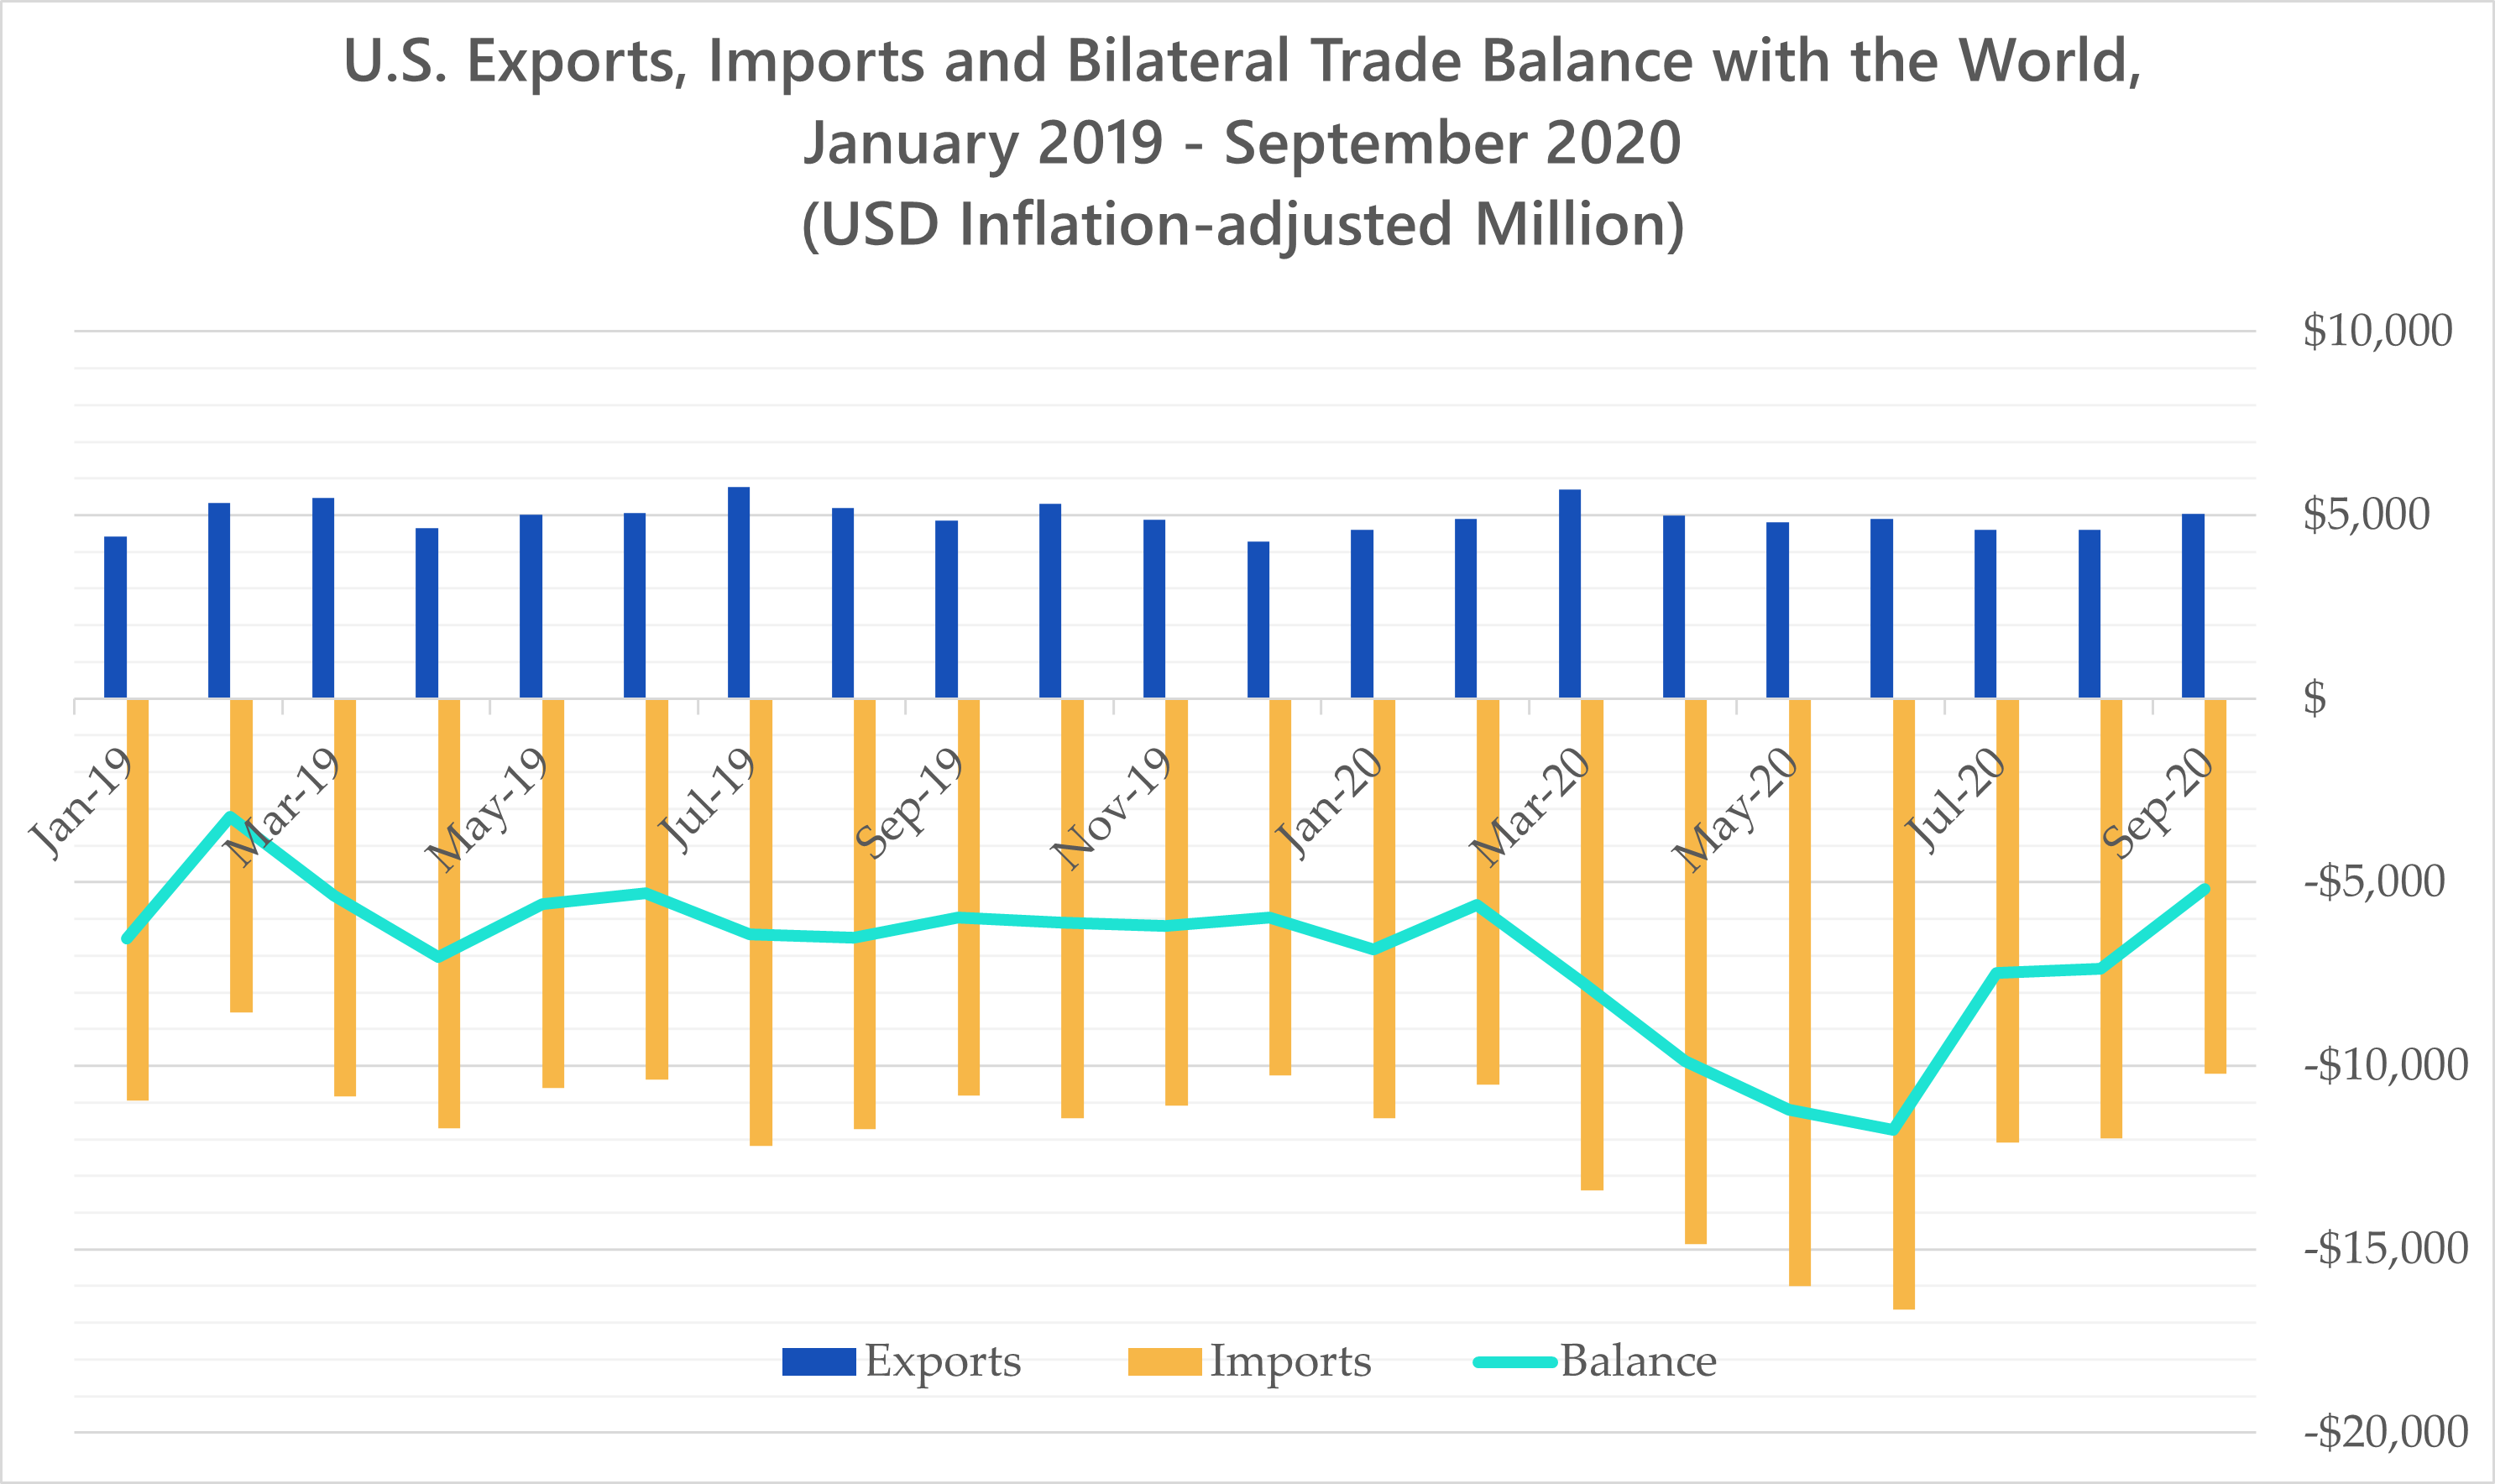
- Updated data showing that the U.S. has grown even more dependent on imports from China and the rest of the world. for key medical goods during the COVID-19 era as the U.S.-China and U.S.-world deficits in COVID-19 related medical goods increased until June and have not returned to pre-pandemic levels through September 2020.
- Data showing from what countries imports into the U.S. of key COVID-19 response goods are sourced over time. (Wherever possible, we include data showing volume, not only value. Volume more accurately represents what is actually being traded, given that the value data often reflects distortions in price caused by corporate tax manipulations and transfer pricing.).
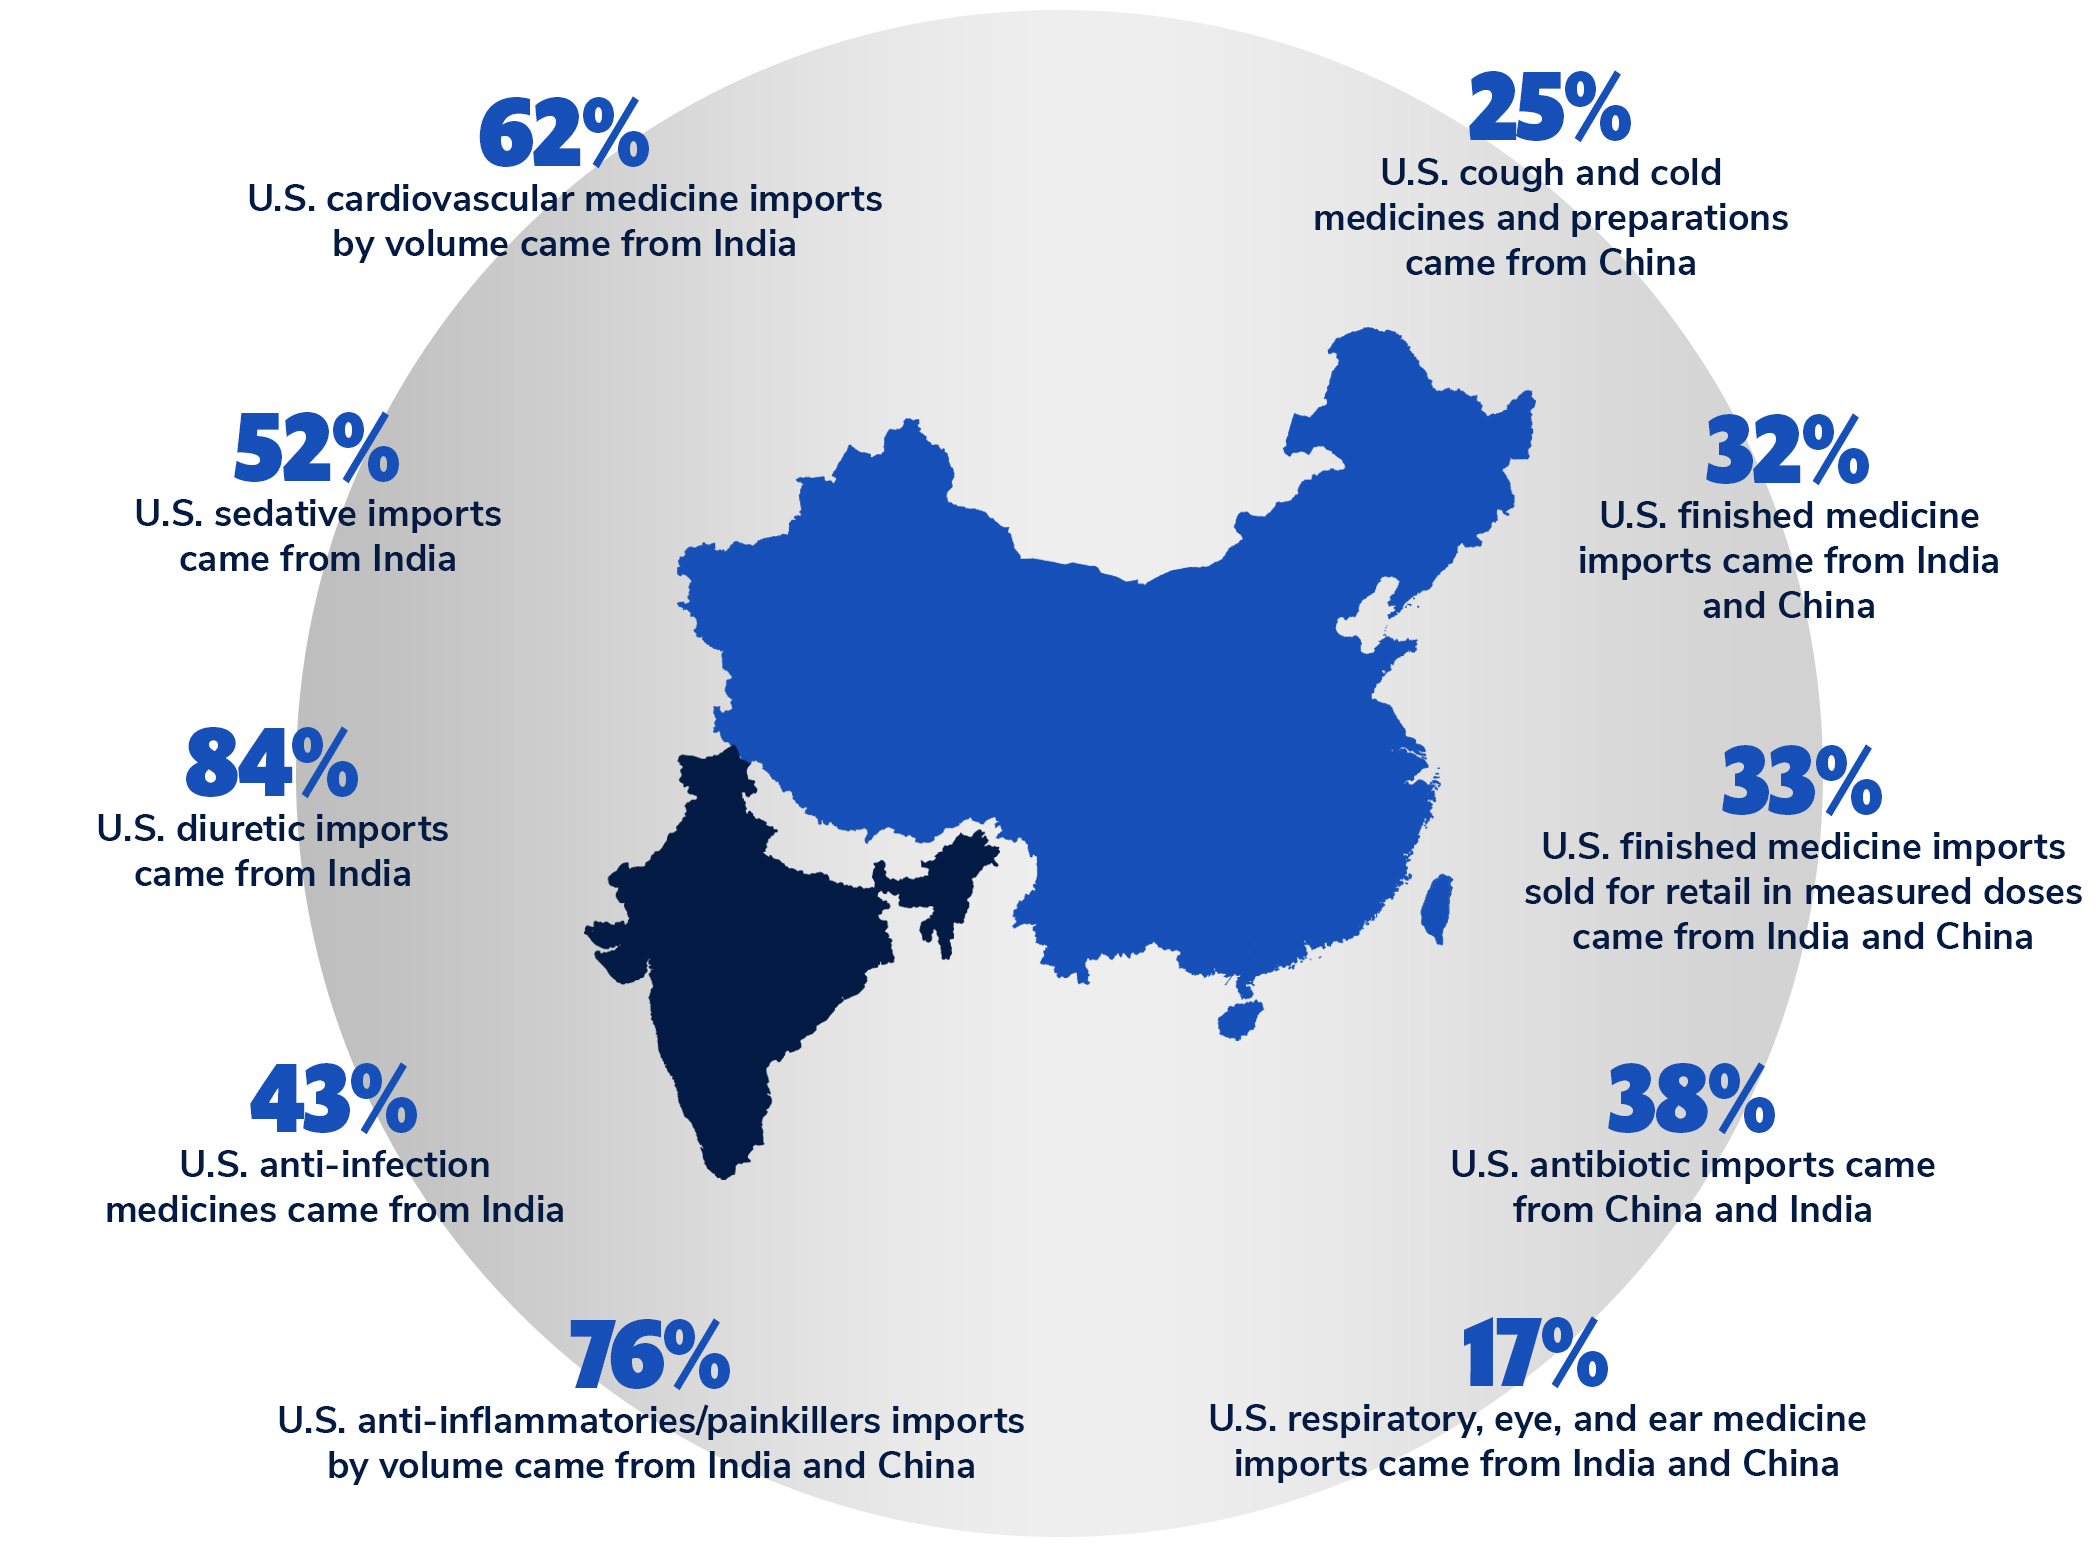
- New information about the countries from which the United States imported medicines in 2019 (the latest full year data available) that show deep U.S. reliance on China and India for many categories of medicines.
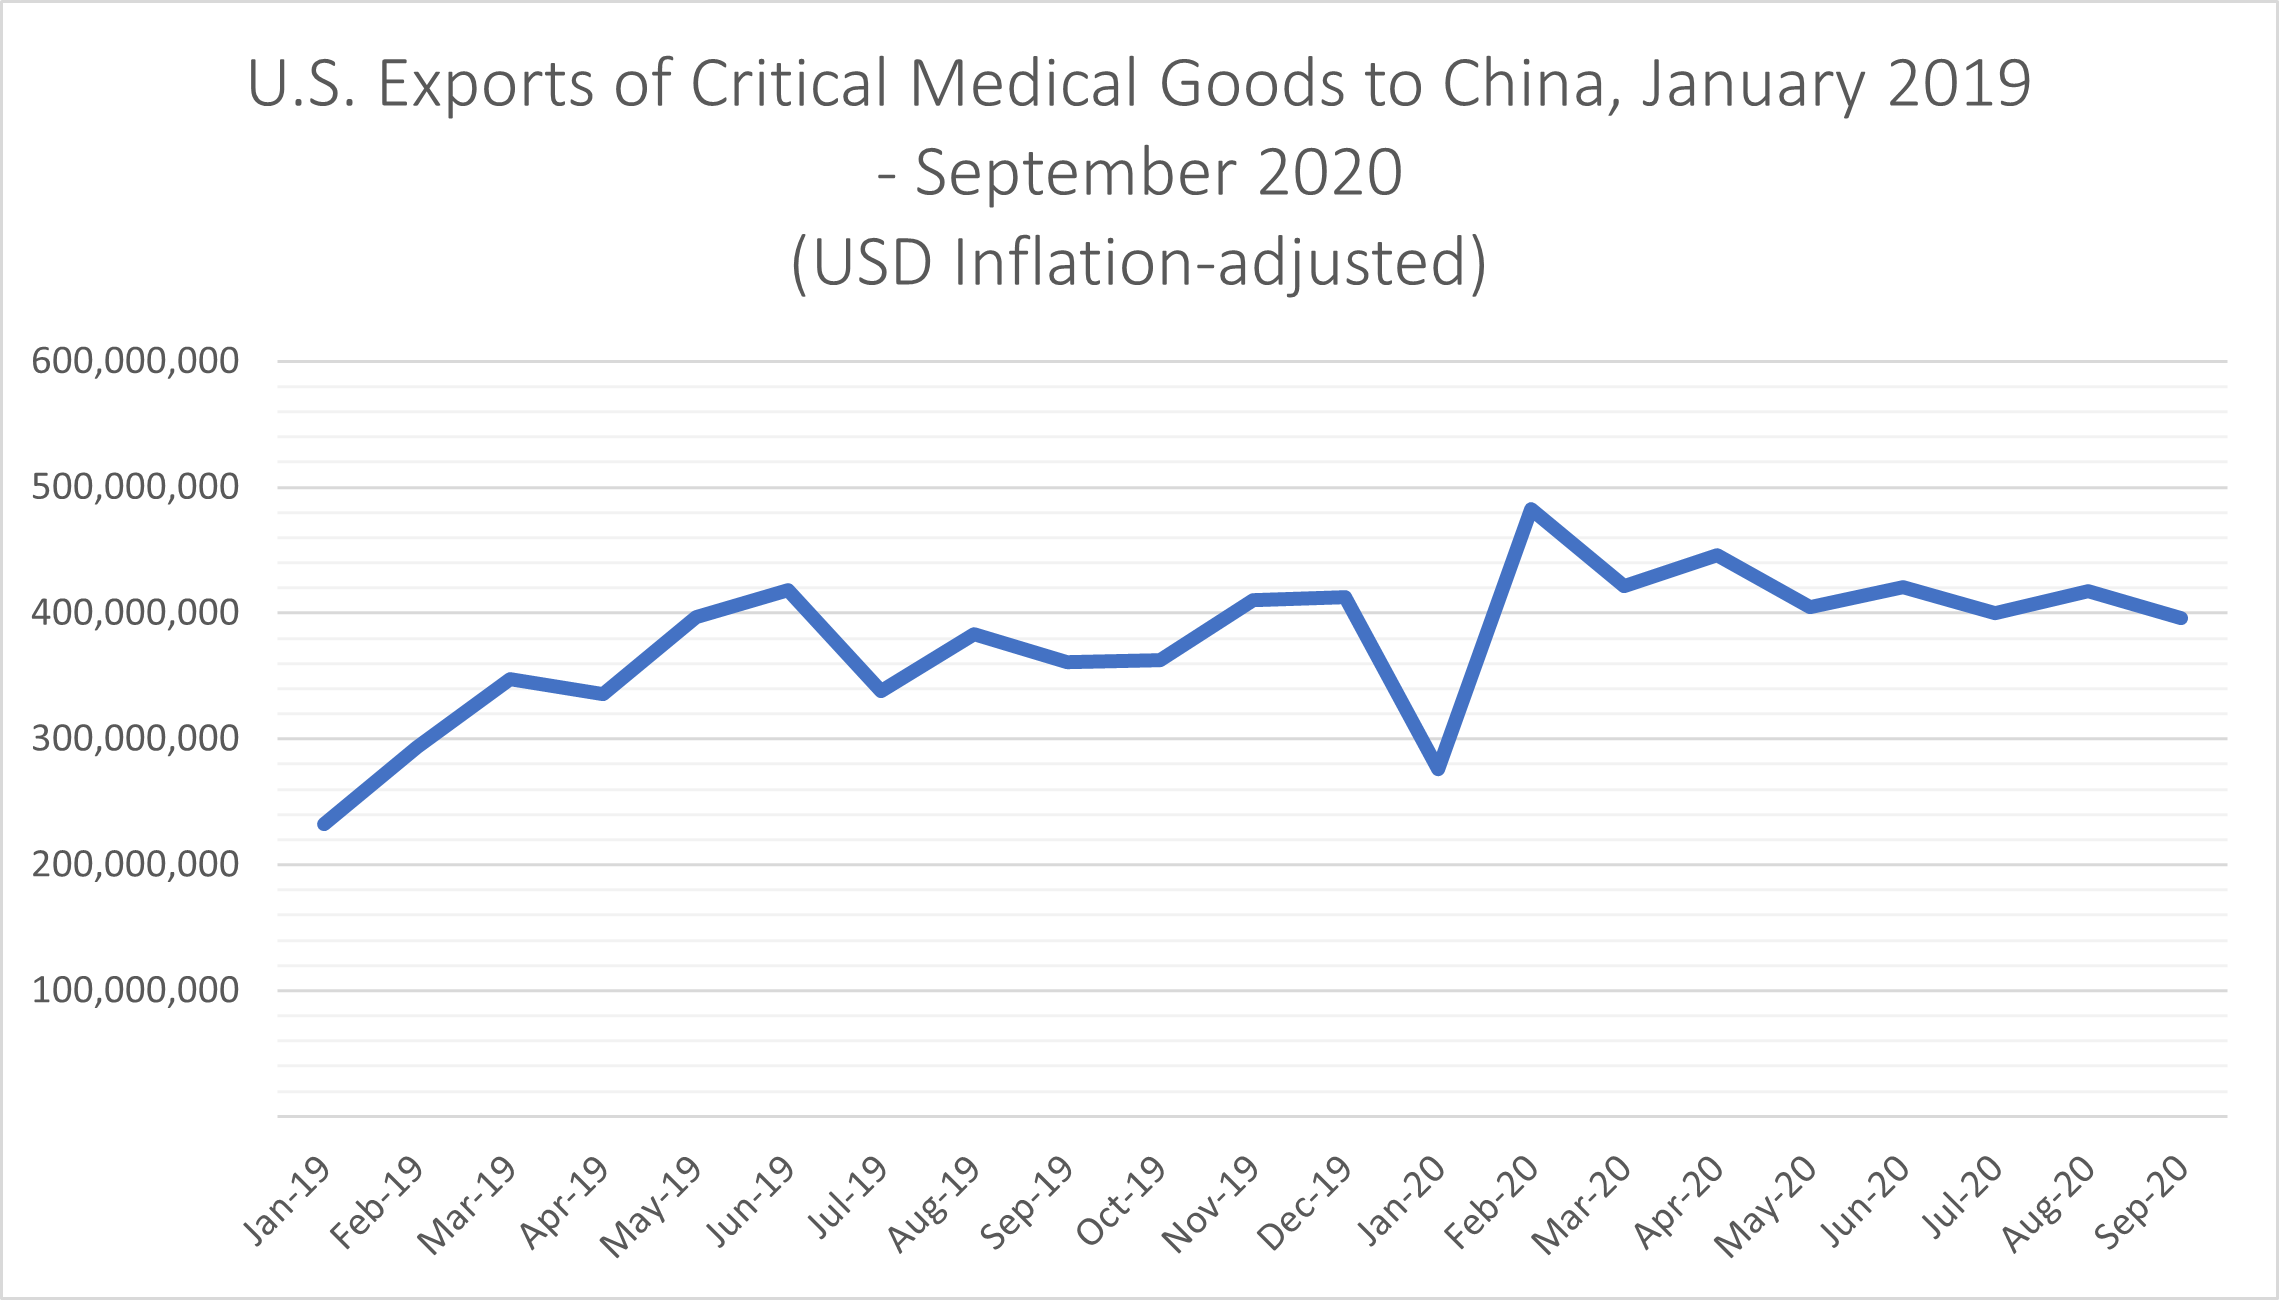
- Data showing that U.S. exports of masks to the world continued to spike up until September 2020 after a major increase in U.S. exports of critical medical goods to China when U.S. domestic demand was highest in January-April 2020.
Having the world’s largest trade deficit year after year means the United States is extremely reliant on other countries to provide essential goods. As the COVID-19 crisis emerged in the beginning of 2020, U.S. government officials urged U.S. firms to expand exports to China of the limited U.S. domestic production of key medical goods instead of considering U.S. residents’ needs. Effective implementation of the Defense Production Act (DPA) to purchase and domestically allocate PPE, ventilators and more would have preempted the export frenzy we see in the data. Unfortunately, Americans are still in the dark about the extent to which these critical emergency powers have been used to control exports of critical supplies.
With many critical goods now mainly made in one or two countries, when workers there fall ill or governments prioritize their own peoples’ needs before exporting goods away, a worldwide shortage of masks, gloves, medicine and more quickly develops.
And, it’s hard to quickly increase production elsewhere. Long, thin globalized supply chains make it difficult to source inputs, parts and components needed to scale up domestic production during this crisis. And, monopoly patent protections in many trade agreements expose countries to trade sanctions if they produce medicine, ventilators and more without approval by and payment to pharmaceutical and other firms.
With policymakers and the public distracted, corporate lobbyists are pushing for more of the same trade policies that hatched the unreliable supply chains now failing us all. Instead, we must fundamentally reexamine U.S. trade policy. The goals should be healthy, resilient communities and economic well-being for more people – not the current priority of maximizing corporate profits.
U.S. Exports, Imports and Bilateral Trade Balance with China, January 2019 – September 2020
(USD Inflation-adjusted Million)
U.S. Exports, Imports and Bilateral Trade Balance with the World, January 2019 – September 2020 (USD Inflation-adjusted Million)
Adjusted for Inflation
TOP SOURCES OF KEY COVID-RESPONSE IMPORTS TO THE UNITED STATES
Wherever possible, we include data showing volume, not only value. Volume more accurately represents what is actually being traded. The value data often reflects distortions in price caused by patents and corporate tax manipulations.
COVID-19 RELATED MEDICAL DEVICESTop Sources of U.S. Imports of Medical Devices by Value (USD) |
||||||||||
| 2019 | 2009 | 1999 | ||||||||
| Sources | Value | Participation | Sources | Value | Participation | Sources | Value | Participation | ||
| Mexico | 8,206,754,770 | 27% | Mexico | 3,881,982,719 | 26% | Mexico | 1,323,268,397 | 21% | ||
| Germany | 3,265,161,773 | 11% | Germany | 2,032,245,572 | 14% | Japan | 987,700,579 | 16% | ||
| China | 2,269,586,172 | 7% | Japan | 1,366,309,778 | 9% | Germany | 857,000,470 | 13% | ||
| Ireland | 2,201,134,608 | 7% | China | 1,088,679,998 | 7% | Dominican Rep | 348,912,546 | 5% | ||
| Japan | 2,084,490,902 | 7% | Ireland | 966,863,757 | 7% | Israel | 334,790,641 | 5% | ||
| Costa Rica | 1,728,075,021 | 6% | Costa Rica | 620,810,194 | 4% | Ireland | 327,237,977 | 5% | ||
| Singapore | 1,274,502,458 | 4% | Dominican Rep | 506,420,583 | 3% | United Kingdom | 268,411,776 | 4% | ||
| Switzerland | 1,260,918,781 | 4% | Switzerland | 486,686,915 | 3% | Netherlands | 223,981,235 | 4% | ||
| Israel | 981,734,772 | 3% | Australia | 391,730,743 | 3% | Singapore | 223,661,066 | 4% | ||
| Dominican Rep | 805,123,270 | 3% | Netherlands | 377,391,378 | 3% | Canada | 193,381,083 | 3% | ||
| Rest of World | 6,368,372,062 | 21% | Rest of World | 3,143,282,330 | 21% | Rest of World | 1,281,333,928 | 20% | ||
| Total | 30,445,854,589 | 100% | Total | 14,862,403,967 | 100% | Total | 6,369,679,698 | 100% | ||
Source: U.S. International Trade Commission
Top Sources of U.S. Imports of Electrocardiographs (9018.11.3000) by Value (USD) |
||||||||||
| 2019 | 2009 | 1999 | ||||||||
| Sources | Value | Participation | Sources | Value | Participation | Sources | Value | Participation | ||
| Switzerland | 312,242,442 | 92% | India | 4,040,784 | 32% | China | 9,435,659 | 53% | ||
| Mexico | 13,733,208 | 4% | Switzerland | 2,022,518 | 16% | Switzerland | 3,689,378 | 21% | ||
| India | 4,595,142 | 1% | China | 1,618,821 | 13% | Germany | 1,857,834 | 10% | ||
| China | 3,182,740 | 1% | Germany | 1,553,654 | 12% | Japan | 1,517,245 | 8% | ||
| Singapore | 1,333,572 | 0% | Japan | 1,058,598 | 8% | Israel | 467,834 | 3% | ||
| Germany | 1,233,669 | 0% | Israel | 599,964 | 5% | Italy | 360,209 | 2% | ||
| Slovakia | 433,524 | 0% | United Kingdom | 387,796 | 3% | Australia | 272,593 | 2% | ||
| Israel | 398,477 | 0% | France | 210,380 | 2% | United Kingdom | 153,495 | 1% | ||
| United Kingdom | 296,941 | 0% | Austria | 209,295 | 2% | Sweden | 45,726 | 0% | ||
| South Korea | 250,476 | 0% | Netherlands | 148,904 | 1% | Brazil | 36,650 | 0% | ||
| Rest of the World | 857366 | 0% | Rest of the World | 866915 | 7% | Rest of the World | 85432 | 0% | ||
| Total | 338,557,557 | 100% | Total | 12,717,629 | 100% | Total | 17,922,055 | 100% | ||
Source: U.S. International Trade Commission
Top Sources of U.S. Imports of Electrocardiographs (9018.11.3000) by Volume (Unit) |
||||||||||
| 2019 | 2009 | 1999 | ||||||||
| Sources | Volume | Participation | Sources | Volume | Participation | Sources | Volume | Participation | ||
| Switzerland | 122,337 | 80% | Germany | 3,867 | 24% | China | 3,531 | 29% | ||
| Mexico | 7,993 | 5% | India | 3,012 | 19% | Japan | 2,871 | 23% | ||
| India | 5,915 | 4% | China | 2,550 | 16% | Switzerland | 2,427 | 20% | ||
| China | 5,504 | 4% | Switzerland | 1,903 | 12% | Israel | 1,484 | 12% | ||
| Germany | 4,858 | 3% | Japan | 1,110 | 7% | Germany | 1,226 | 10% | ||
| Slovakia | 2,724 | 2% | Austria | 1,000 | 6% | Italy | 365 | 3% | ||
| Israel | 723 | 0% | United Kingdom | 608 | 4% | United Kingdom | 169 | 1% | ||
| Singapore | 636 | 0% | Israel | 482 | 3% | Australia | 58 | 0% | ||
| South Korea | 607 | 0% | Netherlands | 258 | 2% | Brazil | 50 | 0% | ||
| Japan | 383 | 0% | Italy | 207 | 1% | Hungary | 29 | 0% | ||
| Rest of the World | 1,103 | 1% | Rest of the World | 1,080 | 7% | Rest of the World | 45 | 0% | ||
| Total | 152,783 | 100% | Total | 16,077 | 100% | Total | 12,255 | 100% | ||
Source: U.S. International Trade Commission
Top Sources of U.S. Imports of Ultrasound Machines (9018.12.0000) by Value (USD) |
||||||||||
| 2019 | 2009 | 1999 | ||||||||
| Sources | Value | Participation | Sources | Value | Participation | Sources | Value | Participation | ||
| South Korea | 111,743,432 | 28% | South Korea | 41,726,463 | 21% | Japan | 38,985,176 | 35% | ||
| China | 78,437,997 | 20% | Japan | 32,735,680 | 17% | South Korea | 26,831,897 | 24% | ||
| Japan | 48,046,656 | 12% | Singapore | 18,540,143 | 10% | Norway | 14,541,819 | 13% | ||
| Malaysia | 33,730,387 | 9% | Canada | 18,175,102 | 9% | Denmark | 10,031,801 | 9% | ||
| France | 21,931,382 | 6% | China | 16,993,907 | 9% | Mexico | 4,021,229 | 4% | ||
| Norway | 21,834,486 | 6% | Austria | 13,242,438 | 7% | Austria | 3,693,976 | 3% | ||
| Mexico | 21,258,031 | 5% | Italy | 8,003,638 | 4% | Netherlands | 2,696,723 | 2% | ||
| Canada | 12,903,283 | 3% | France | 7,519,686 | 4% | Germany | 2,395,929 | 2% | ||
| Austria | 11,242,916 | 3% | Norway | 7,480,253 | 4% | Canada | 1,843,560 | 2% | ||
| Israel | 10,805,965 | 3% | Netherlands | 4,926,542 | 3% | United Kingdom | 1,610,859 | 1% | ||
| Rest of the World | 23,712,431 | 6% | Rest of the World | 25,099,268 | 13% | Rest of the World | 4,311,522 | 4% | ||
| Total | 395,646,966 | 100% | Total | 194,443,120 | 100% | Total | 110,964,491 | 100% | ||
Source: U.S. International Trade Commission
Top Sources of U.S. Imports of Ultrasound Machines (9018.12.0000) by Volume (Unit) |
||||||||||
| 2019 | 2009 | 1999 | ||||||||
| Sources | Volume | Participation | Sources | Volume | Participation | Sources | Volume | Participation | ||
| South Korea | 208,050 | 37% | Singapore | 79,922 | 42% | Japan | 3,683 | 22% | ||
| Malaysia | 117,261 | 21% | South Korea | 29,051 | 15% | South Korea | 3,081 | 19% | ||
| France | 73,227 | 13% | China | 20,933 | 11% | Mexico | 2,322 | 14% | ||
| China | 66,709 | 12% | United Kingdom | 16,780 | 9% | Denmark | 2,120 | 13% | ||
| Japan | 19,432 | 3% | Malaysia | 13,643 | 7% | Netherlands | 1,842 | 11% | ||
| Taiwan | 18,277 | 3% | Japan | 12,102 | 6% | Canada | 1,146 | 7% | ||
| Mexico | 12,273 | 2% | France | 4,491 | 2% | Norway | 666 | 4% | ||
| Denmark | 9,307 | 2% | Mexico | 2,781 | 1% | Germany | 318 | 2% | ||
| United Kingdom | 7,366 | 1% | Canada | 2,669 | 1% | United Kingdom | 296 | 2% | ||
| India | 6,069 | 1% | Taiwan | 1,651 | 1% | India | 243 | 1% | ||
| Rest of the World | 17,685 | 3% | Rest of the World | 6,937 | 4% | Rest of the World | 717 | 4% | ||
| Total | 555,656 | 100% | Total | 190,960 | 100% | Total | 16,434 | 100% | ||
Source: U.S. International Trade Commission
Top Sources of U.S. Imports of Endoscopes (9018.19.4000) by Value (USD) |
||||||||||
| 2019 | 2009 | 1999 | ||||||||
| Sources | Value | Participation | Sources | Value | Participation | Sources | Value | Participation | ||
| Japan | 687,143,667 | 71% | Japan | 408,792,075 | 78% | Japan | 244,710,990 | 84% | ||
| Germany | 76,690,789 | 8% | Germany | 38,660,822 | 7% | Germany | 25,004,010 | 9% | ||
| Israel | 51,960,605 | 5% | Ireland | 25,830,648 | 5% | United Kingdom | 7,386,738 | 3% | ||
| China | 28,627,553 | 3% | China | 7,540,606 | 1% | Sweden | 6,943,932 | 2% | ||
| Canada | 28,424,647 | 3% | United Kingdom | 5,867,348 | 1% | Norway | 2,470,677 | 1% | ||
| Mexico | 13,801,026 | 1% | Israel | 5,864,410 | 1% | Switzerland | 859,137 | 0% | ||
| United Kingdom | 13,656,834 | 1% | Mexico | 5,686,110 | 1% | Israel | 840,950 | 0% | ||
| Vietnam | 11,648,290 | 1% | South Korea | 2,822,135 | 1% | Canada | 815,366 | 0% | ||
| Thailand | 10,273,208 | 1% | Finland | 2,718,856 | 1% | Ireland | 760,098 | 0% | ||
| Czech Republic | 9,050,237 | 1% | Thailand | 2,550,000 | 0% | Spain | 569,685 | 0% | ||
| Rest of the World | 36,410,590 | 4% | Rest of the World | 16,333,604 | 3% | Rest of the World | 1,866,247 | 1% | ||
| Total | 967,687,446 | 100% | Total | 522,666,614 | 100% | Total | 292,227,830 | 100% | ||
Source: U.S. International Trade Commission
Top Sources of U.S. Imports of Patient Monitoring Systems (9018.19.5500) by Value (USD) |
||||||||||
| 2019 | 2009 | 1999 | ||||||||
| Sources | Value | Participation | Sources | Value | Participation | Sources | Value | Participation | ||
| Japan | 687,143,667 | 71% | Japan | 408,792,075 | 78% | Japan | 244,710,990 | 84% | ||
| Germany | 76,690,789 | 8% | Germany | 38,660,822 | 7% | Germany | 25,004,010 | 9% | ||
| Israel | 51,960,605 | 5% | Ireland | 25,830,648 | 5% | United Kingdom | 7,386,738 | 3% | ||
| China | 28,627,553 | 3% | China | 7,540,606 | 1% | Sweden | 6,943,932 | 2% | ||
| Canada | 28,424,647 | 3% | United Kingdom | 5,867,348 | 1% | Norway | 2,470,677 | 1% | ||
| Mexico | 13,801,026 | 1% | Israel | 5,864,410 | 1% | Switzerland | 859,137 | 0% | ||
| United Kingdom | 13,656,834 | 1% | Mexico | 5,686,110 | 1% | Israel | 840,950 | 0% | ||
| Vietnam | 11,648,290 | 1% | South Korea | 2,822,135 | 1% | Canada | 815,366 | 0% | ||
| Thailand | 10,273,208 | 1% | Finland | 2,718,856 | 1% | Ireland | 760,098 | 0% | ||
| Czech Republic | 9,050,237 | 1% | Thailand | 2,550,000 | 0% | Spain | 569,685 | 0% | ||
| Rest of the World | 36,410,590 | 4% | Rest of the World | 16,333,604 | 3% | Rest of the World | 1,866,247 | 1% | ||
| Total | 967,687,446 | 100% | Total | 522,666,614 | 100% | Total | 292,227,830 | 100% | ||
Source: U.S. International Trade Commission
Top Sources of U.S. Imports of Ventilators and Other Oxygen Therapy Equipment (9019.20.0000) by Value (USD) |
||||||||||
| 2019 | 2009 | 1999 | ||||||||
| Sources | Value | Participation | Sources | Value | Participation | Sources | Value | Participation | ||
| Singapore | 919,514,568 | 34% | Australia | 373,175,399 | 29% | Mexico | 105,160,948 | 31% | ||
| China | 449,464,657 | 17% | Mexico | 305,683,459 | 23% | Ireland | 63,011,992 | 18% | ||
| Mexico | 413,691,914 | 15% | China | 204,273,285 | 16% | Australia | 36,344,533 | 11% | ||
| Australia | 256,030,776 | 9% | New Zealand | 99,741,082 | 8% | Sweden | 28,780,950 | 8% | ||
| New Zealand | 117,354,100 | 4% | Singapore | 57,072,576 | 4% | New Zealand | 17,581,910 | 5% | ||
| Sweden | 90,193,501 | 3% | Ireland | 42,710,580 | 3% | Germany | 17,360,441 | 5% | ||
| Ireland | 79,207,770 | 3% | Germany | 34,968,403 | 3% | Italy | 10,851,326 | 3% | ||
| Germany | 62,829,431 | 2% | United Kingdom | 32,703,362 | 2% | Malaysia | 10,739,064 | 3% | ||
| Switzerland | 58,287,916 | 2% | Canada | 25,116,165 | 2% | China | 10,398,954 | 3% | ||
| Malaysia | 57,848,627 | 2% | Taiwan | 24,773,861 | 2% | Canada | 7,986,373 | 2% | ||
| Rest of the World | 192,658,895 | 7% | Rest of the World | 108,837,344 | 8% | Rest of the World | 34,624,541 | 10% | ||
| Total | 2,697,082,155 | 100% | Total | 1,309,055,516 | 100% | Total | 342,841,032 | 100% | ||
Source: U.S. International Trade Commission
PERSONAL PROTECTIVE EQUIPMENTTop Sources of U.S. Imports of Personal Protective Equipment by Value (USD) |
||||||||||
| 2019 | 2009 | 1999 | ||||||||
| Sources | Value | Participation | Sources | Value | Participation | Sources | Value | Participation | ||
| China | 4,789,919,170 | 47% | China | 2,573,442,752 | 51% | China | 287,166,310 | 30% | ||
| Malaysia | 1,650,146,772 | 16% | Malaysia | 766,280,823 | 15% | Mexico | 235,726,306 | 25% | ||
| Mexico | 839,339,263 | 8% | Thailand | 444,628,937 | 9% | Taiwan | 115,319,905 | 12% | ||
| Thailand | 718,162,744 | 7% | Mexico | 339,641,507 | 7% | Malaysia | 88,458,679 | 9% | ||
| Canada | 381,046,610 | 4% | Canada | 182,692,449 | 4% | Honduras | 39,024,211 | 4% | ||
| Vietnam | 249,745,714 | 2% | Taiwan | 124,523,426 | 2% | Canada | 29,982,771 | 3% | ||
| Taiwan | 234,608,334 | 2% | Indonesia | 97,156,765 | 2% | France | 26,101,202 | 3% | ||
| India | 158,015,459 | 2% | Honduras | 79,030,904 | 2% | Thailand | 15,607,020 | 2% | ||
| Indonesia | 152,155,098 | 1% | Germany | 73,261,590 | 1% | United Kingdom | 15,465,478 | 2% | ||
| Germany | 93,837,033 | 1% | India | 39,437,272 | 1% | Indonesia | 12,059,194 | 1% | ||
| Rest of the World | 890,445,604 | 9% | Rest of the World | 303,205,172 | 6% | Rest of the World | 92,979,365 | 10% | ||
| Total | 10,157,421,801 | 100% | Total | 5,023,301,597 | 100% | Total | 957,890,441 | 100% | ||
Source: U.S. International Trade Commission
Top Sources of U.S. Imports of Aprons and Gowns by Value (USD) |
||||||||||
| 2019 | 2009 | 1999 | ||||||||
| Sources | Value | Participation | Sources | Value | Participation | Sources | Value | Participation | ||
| China | 394,217,278 | 45% | China | 199,947,785 | 75% | China | 72,656,172 | 75% | ||
| Canada | 146,455,529 | 17% | Canada | 39,026,866 | 15% | Taiwan | 4,323,011 | 4% | ||
| India | 68,081,499 | 8% | Mexico | 4,060,177 | 2% | Mexico | 3,983,834 | 4% | ||
| Vietnam | 64,258,956 | 7% | Hong Kong | 3,630,402 | 1% | Hong Kong | 2,899,286 | 3% | ||
| Pakistan | 40,116,024 | 5% | Taiwan | 3,181,853 | 1% | Canada | 2,216,622 | 2% | ||
| Mexico | 37,643,170 | 4% | Thailand | 2,891,590 | 1% | South Korea | 2,134,193 | 2% | ||
| Cambodia | 22,696,136 | 3% | Italy | 2,890,597 | 1% | Italy | 1,211,157 | 1% | ||
| Taiwan | 14,609,752 | 2% | Vietnam | 1,985,498 | 1% | Philippines | 784,579 | 1% | ||
| Indonesia | 13,603,980 | 2% | Lithuania | 1,351,282 | 1% | France | 767,985 | 1% | ||
| Guatemala | 8,618,654 | 1% | France | 1,150,550 | 0% | Sweden | 750,569 | 1% | ||
| Rest of World | 73,399,683 | 8% | Rest of World | 6,182,272 | 2% | Rest of World | 5,002,290 | 5% | ||
| Total | 883,700,661 | 100% | Total | 266,298,872 | 100% | Total | 96,729,698 | 100% | ||
Source: U.S. International Trade Commission
Top Sources of U.S. Imports of Aprons and Gowns by Volume (Dozens) |
||||||||||
| 2019 | 2009 | 1999 | ||||||||
| Sources | Volume | Participation | Sources | Volume | Participation | Sources | Volume | Participation | ||
| China | 106,501,885 | 89% | China | 64,381,058 | 95% | China | 25,474,017 | 85% | ||
| Vietnam | 2,830,336 | 2% | Thailand | 1,221,750 | 2% | Hong Kong | 2,058,656 | 7% | ||
| India | 2,517,973 | 2% | Hong Kong | 996,082 | 1% | Taiwan | 492,922 | 2% | ||
| Cambodia | 2,042,470 | 2% | Taiwan | 584,575 | 1% | Mexico | 447,509 | 1% | ||
| Pakistan | 1,683,581 | 1% | Mexico | 132,656 | 0% | South Korea | 431,400 | 1% | ||
| Mexico | 516,897 | 0% | Vietnam | 117,630 | 0% | Italy | 293,364 | 1% | ||
| Taiwan | 475,952 | 0% | Italy | 67,808 | 0% | Switzerland | 168,466 | 1% | ||
| Burma | 427,490 | 0% | South Korea | 39,128 | 0% | Thailand | 146,509 | 0% | ||
| Thailand | 364,919 | 0% | Egypt | 36,335 | 0% | Honduras | 128,522 | 0% | ||
| Canada | 273,010 | 0% | Indonesia | 34,471 | 0% | Philippines | 113,294 | 0% | ||
| Rest of the World | 1,667,121 | 1% | Rest of the World | 209,947 | 0% | Rest of the World | 389,832 | 1% | ||
| Total | 119,301,634 | 100% | Total | 67,821,440 | 100% | Total | 30,144,491 | 100% | ||
Source: U.S. International Trade Commission
Top Sources of U.S. Imports of Gloves by Value (USD) |
||||||||||
| 2019 | 2009 | 1999 | ||||||||
| Sources | Value | Participation | Sources | Value | Participation | Sources | Value | Participation | ||
| Malaysia | 1,636,351,961 | 48% | Malaysia | 757,294,454 | 36% | China | 125,203,731 | 38% | ||
| China | 968,699,496 | 28% | China | 727,530,388 | 35% | Malaysia | 86,424,307 | 26% | ||
| Thailand | 554,709,370 | 16% | Thailand | 414,378,024 | 20% | Taiwan | 51,891,839 | 16% | ||
| Indonesia | 133,839,928 | 4% | Indonesia | 90,115,567 | 4% | Canada | 14,562,730 | 4% | ||
| Sri Lanka | 48,856,514 | 1% | Sri Lanka | 34,301,383 | 2% | Thailand | 12,703,424 | 4% | ||
| Vietnam | 39,983,252 | 1% | Pakistan | 9,067,088 | 0% | Indonesia | 11,511,608 | 3% | ||
| Pakistan | 17,887,281 | 1% | Taiwan | 8,839,995 | 0% | United Arab Em | 5,240,846 | 2% | ||
| South Korea | 5,474,283 | 0% | Vietnam | 7,387,623 | 0% | Belgium | 4,834,392 | 1% | ||
| Taiwan | 5,233,797 | 0% | Mexico | 6,714,319 | 0% | Sri Lanka | 4,158,679 | 1% | ||
| Guatemala | 2,353,410 | 0% | Colombia | 4,584,149 | 0% | Mexico | 3,271,499 | 1% | ||
| Rest of World | 17,513,772 | 1% | Rest of World | 14,796,549 | 1% | Rest of World | 12,530,172 | 4% | ||
| Total | 3,430,903,064 | 100% | Total | 2,075,009,539 | 100% | Total | 332,333,227 | 100% | ||
Source: U.S. International Trade Commission
Top Sources of U.S. Imports of Gloves by Volume (Dozen Pairs) |
||||||||||
| 2019 | 2009 | 1999 | ||||||||
| Sources | Volume | Participation | Sources | Volume | Participation | Sources | Volume | Participation | ||
| China | 2,691,291,220 | 43% | China | 1,613,588,100 | 50% | China | 275,436,206 | 51% | ||
| Malaysia | 2,577,501,552 | 42% | Malaysia | 943,014,505 | 29% | Taiwan | 97,770,844 | 18% | ||
| Thailand | 613,777,726 | 10% | Thailand | 472,690,951 | 15% | Malaysia | 71,805,469 | 13% | ||
| Indonesia | 213,290,574 | 3% | Indonesia | 160,765,621 | 5% | Thailand | 25,327,097 | 5% | ||
| Vietnam | 66,178,365 | 1% | Taiwan | 18,276,211 | 1% | Indonesia | 24,337,404 | 5% | ||
| Sri Lanka | 17,809,904 | 0% | Vietnam | 14,389,649 | 0% | Canada | 20,394,716 | 4% | ||
| Taiwan | 4,276,701 | 0% | Sri Lanka | 12,112,853 | 0% | Belgium | 7,429,906 | 1% | ||
| Hong Kong | 2,410,565 | 0% | Colombia | 10,331,921 | 0% | Hong Kong | 3,747,009 | 1% | ||
| India | 1,754,830 | 0% | Hong Kong | 4,648,481 | 0% | India | 3,520,619 | 1% | ||
| South Korea | 1,547,515 | 0% | South Korea | 1,838,962 | 0% | South Korea | 1,079,785 | 0% | ||
| Rest of the World | 7,665,792 | 0% | Rest of the World | 4,466,608 | 0% | Rest of the World | 4,020,324 | 1% | ||
| Total | 6,197,504,744 | 100% | Total | 3,256,123,862 | 100% | Total | 534,869,379 | 100% | ||
Source: U.S. International Trade Commission
Top Sources of U.S. Imports of Face Masks (6307.90.9889) by Value (USD) |
||||||||||
| 2019 | 2009 | 1999 | ||||||||
| Sources | Value | Participation | Sources | Value | Participation | Sources | Value | Participation | ||
| China | 2,319,451,193 | 72% | China | 1,046,568,422 | 71% | N/A | N/A | N/A | ||
| Mexico | 293,579,032 | 9% | Mexico | 161,682,578 | 11% | N/A | N/A | N/A | ||
| Canada | 109,980,688 | 3% | Canada | 44,710,166 | 3% | N/A | N/A | N/A | ||
| Vietnam | 83,285,631 | 3% | India | 36,156,852 | 2% | N/A | N/A | N/A | ||
| India | 83,215,737 | 3% | Taiwan | 33,807,590 | 2% | N/A | N/A | N/A | ||
| Taiwan | 56,208,998 | 2% | Thailand | 15,180,224 | 1% | N/A | N/A | N/A | ||
| Pakistan | 26,037,908 | 1% | Vietnam | 14,190,569 | 1% | N/A | N/A | N/A | ||
| Thailand | 21,079,299 | 1% | United Kingdom | 12,822,696 | 1% | N/A | N/A | N/A | ||
| Japan | 19,046,809 | 1% | Pakistan | 12,054,734 | 1% | N/A | N/A | N/A | ||
| Germany | 18,898,225 | 1% | Germany | 9,043,868 | 1% | N/A | N/A | N/A | ||
| Rest of World | 185,022,065 | 6% | Rest of World | 80,519,706 | 5% | Rest of World | N/A | N/A | ||
| Total | 3,215,805,585 | 100% | Total | 1,466,737,405 | 100% | Total | N/A | N/A | ||
Source: U.S. International Trade Commission
Top Sources of U.S. Imports of Face Masks (6307.90.9889) by Volume (Units) |
||||||||||
| 2019 | 2009 | 1999 | ||||||||
| Sources | Volume | Participation | Sources | Volume | Participation | Sources | Volume | Participation | ||
| China | 4,488,157,255 | 69% | China | 2,598,124,878 | 64% | N/A | N/A | N/A | ||
| Mexico | 696,544,156 | 11% | Mexico | 975,892,655 | 24% | N/A | N/A | N/A | ||
| Japan | 246,219,460 | 4% | Thailand | 120,392,058 | 3% | N/A | N/A | N/A | ||
| Canada | 245,886,564 | 4% | Taiwan | 49,018,724 | 1% | N/A | N/A | N/A | ||
| India | 196,749,251 | 3% | India | 42,476,021 | 1% | N/A | N/A | N/A | ||
| Thailand | 146,747,975 | 2% | Canada | 37,798,706 | 1% | N/A | N/A | N/A | ||
| Vietnam | 105,189,436 | 2% | Colombia | 35,122,968 | 1% | N/A | N/A | N/A | ||
| Israel | 72,936,684 | 1% | Pakistan | 25,324,898 | 1% | N/A | N/A | N/A | ||
| Taiwan | 52,179,062 | 1% | Indonesia | 19,920,989 | 0% | N/A | N/A | N/A | ||
| Pakistan | 48,555,747 | 1% | South Korea | 18,636,706 | 0% | N/A | N/A | N/A | ||
| Rest of the World | 172,385,355 | 3% | Rest of the World | 125,634,467 | 3% | Rest of the World | N/A | N/A | ||
| Total | 6,471,550,945 | 100% | Total | 4,048,343,070 | 100% | Total | 0 | 0% | ||
Source: U.S. International Trade Commission
TOP SOURCES OF KEY MEDICAL DRUGS TO THE UNITED STATES, 2019
Top Source of U.S. Medicines by Volume, 2019 (kg)
| Sources | Volume | Participation |
| India | 95,125,143 | 23% |
| Mexico | 77,492,876 | 19% |
| China | 39,462,531 | 9% |
| Canada | 39,440,557 | 9% |
| Italy | 28,756,717 | 7% |
| Germany | 21,037,695 | 5% |
| United Kingdom | 13,893,620 | 3% |
| Israel | 12,485,452 | 3% |
| Spain | 11,867,480 | 3% |
| Ireland | 11,109,211 | 3% |
| Rest of the World | 64,953,243 | 16% |
| Total | 415,624,525 | 100% |
Source: U.S. International Trade Commission
Top Sources of U.S. Drugs Sold in Measured Doses for Retail by Volume, 2019 (kg)
| Sources | Volume | Participation |
| India | 82,430,392 | 24% |
| Mexico | 77,434,205 | 22% |
| China | 30,404,432 | 9% |
| Canada | 29,080,578 | 8% |
| Italy | 24,221,113 | 7% |
| Germany | 14,393,453 | 4% |
| United Kingdom | 11,529,728 | 3% |
| Spain | 10,488,655 | 3% |
| Ireland | 9,667,305 | 3% |
| Israel | 7,882,120 | 2% |
| Rest of the World | 49,153,437 | 14% |
| Total | 346,685,418 | 100% |
Source: U.S. International Trade Commission
Top Sources of U.S. Anti-Infective Medicines by Volume, 2019 (kg)
| Sources | Volume | Participation |
| India | 3,093,018 | 43% |
| Mexico | 789,822 | 11% |
| Canada | 780,679 | 11% |
| Singapore | 398,201 | 6% |
| France | 303,670 | 4% |
| United Kingdom | 293,441 | 4% |
| Taiwan | 216,549 | 3% |
| Croatia | 183,488 | 3% |
| China | 159,638 | 2% |
| Germany | 157,739 | 2% |
| Rest of the World | 833,891 | 12% |
| Total | 7,210,136 | 100% |
Source: U.S. International Trade Commission
Top Sources of U.S. Cardiovascular Medicines by Volume, 2019 (kg)
| Sources | Volume | Participation |
| India | 16,402,787 | 62% |
| Canada | 3,253,518 | 12% |
| China | 1,017,985 | 4% |
| Singapore | 784,913 | 3% |
| Czech Republic | 767,832 | 3% |
| Italy | 531,616 | 2% |
| Israel | 461,786 | 2% |
| France | 419,683 | 2% |
| Bangladesh | 317,996 | 1% |
| Portugal | 312,855 | 1% |
| Rest of the World | 2,333,623 | 9% |
| Total | 26,604,594 | 100% |
Source: U.S. International Trade Commission
Top Sources of U.S. Anti-Inflammatory Drugs and Painkillers by Volume, 2019 (kg)
| Sources | Volume | Participation |
| China | 10,558,922 | 50% |
| India | 5,588,839 | 26% |
| Canada | 2,067,920 | 10% |
| Japan | 786,779 | 4% |
| Germany | 555,001 | 3% |
| Italy | 261,707 | 1% |
| Israel | 256,285 | 1% |
| Spain | 212,678 | 1% |
| Sweden | 188,958 | 1% |
| Czech Republic | 128,347 | 1% |
| Rest of the World | 673,040 | 3% |
| Total | 21,278,476 | 100% |
Source: U.S. International Trade Commission
Top Sources of U.S. Sedatives by Volume, 2019 (kg)
| Sources | Volume | Participation |
| India | 9,851,067 | 52% |
| Austria | 2,749,435 | 15% |
| Italy | 1,782,049 | 9% |
| Sweden | 1,731,923 | 9% |
| Israel | 675,319 | 4% |
| Norway | 482,706 | 3% |
| Czech Republic | 309,118 | 2% |
| China | 191,250 | 1% |
| Switzerland | 161,641 | 1% |
| France | 157,379 | 1% |
| Rest of the World | 830,443 | 4% |
| Total | 18,922,330 | 100% |
Source: U.S. International Trade Commission
Top Sources of U.S. Diuretics by Volume, 2019 (kg)
| Sources | Volume | Participation |
| India | 1,480,688 | 84% |
| Canada | 129,007 | 7% |
| Czech Republic | 86,315 | 5% |
| Croatia | 61,784 | 3% |
| Italy | 5,347 | 0% |
| Israel | 3,627 | 0% |
| N/A | N/A | N/A |
| N/A | N/A | N/A |
| N/A | N/A | N/A |
| N/A | N/A | N/A |
| Rest of the World | N/A | N/A |
| Total Imports | 1,766,768 | 100% |
Source: U.S. International Trade Commission
Top Sources of U.S. Cough & Cold Medicines by Volume, 2019 (kg)
| Sources | Volume | Participation |
| Canada | 20,093,636 | 37% |
| China | 13,631,559 | 25% |
| Switzerland | 7,155,109 | 13% |
| United Kingdom | 6,969,467 | 13% |
| Mexico | 4,699,574 | 9% |
| India | 992,727 | 2% |
| Spain | 504,460 | 1% |
| Italy | 368,045 | 1% |
| Germany | 106,705 | 0% |
| Pakistan | 23,171 | 0% |
| Rest of the World | 77,802 | 0% |
| Total Imports | 54,622,255 | 100% |
Source: U.S. International Trade Commission
Top Sources of U.S. Drugs Affecting the Respiratory System, Eyes, and Ears by Volume, 2019 (kg)
| Sources | Volume | Participation |
| Ireland | 3,400,505 | 31% |
| France | 1,380,423 | 13% |
| India | 1,371,653 | 13% |
| Canada | 905,788 | 8% |
| South Africa | 766,990 | 7% |
| Belgium | 597,824 | 5% |
| Germany | 484,378 | 4% |
| China | 476,962 | 4% |
| Switzerland | 348,894 | 3% |
| Israel | 302,786 | 3% |
| Rest of the World | 885,830 | 8% |
| Total Imports | 10,922,033 | 100% |
Source: U.S. International Trade Commission
Top Sources of U.S. Antibiotics by Volume, 2019 (kg)
| Sources | Volume | Participation |
| India | 4,559,779 | 27% |
| Italy | 2,604,267 | 16% |
| Jordan | 1,858,484 | 11% |
| China | 1,766,479 | 11% |
| Canada | 1,076,038 | 6% |
| Switzerland | 962,067 | 6% |
| Germany | 760,658 | 5% |
| United Kingdom | 607,031 | 4% |
| Brazil | 515,999 | 3% |
| Austria | 465,984 | 3% |
| Rest of the World | 1,604,320 | 10% |
| Total Imports | 16,781,106 | 100% |
Source: U.S. International Trade Commission
U.S. Import Reliance on China & India for Particular Drugs by Volume, 2019
U.S. EXPORTS OF CRITICAL MEDICAL GOODS TO CHINA AND THE WORLD BY MONTH, JAN. 2019 – SEPT. 2020
Data Notes
Data sourced from the U.S. Census Bureau and the U.S. International Trade Commission. The identification of critical medical goods was based on the U.S. International Trade Commission study “COVID-19 Related Goods: U.S. Imports and Tariffs (Updated)”, which used the World Customs Organization’s (WCO) reports “HS Classification Reference for Covid-19 Medical Supplies” and the World Health Organization (WHO) and World Customs Organization (WCO) report “HS classification reference for Covid-19 medical supplies”.
The Commission’s report identifies the 10-digit codes of COVID-19 related goods in the Harmonized Tariff Schedule of the United States (HTS) for merchandise imported into the United States. Specifically, the study is based on the June 2020 (revision 13) version of the HTS. It is worth noting that the government data reporting U.S. exports does not use the same version of the HTS. Therefore, with respect to exports, in some instances and whenever possible, it was necessary to use different HS codes to identify U.S. exports of Covid-19 related goods when the codes mentioned in the USITC report did not match export data statistics, provided that the description was identical or sufficiently similar so as to confirm that the older version had the same scope as the one used by the USITC for import data.
In some instances, volume data was not available at the needed level of detail or was accounted for in different units of measurement by bilateral trade relationship. The 1999-2019 data is not adjusted for inflation because doing so is not necessary to compare the relative rank of import sources. In contrast, the 2019-2020 monthly data, which measures growth in value over time, is adjusted for inflation to base month July 2020 so that the measurement is growth in real terms.
The table below contains the HTS codes used to retrieve recent import and export data of COVID-19 related goods. In addition, it contains the HTS codes used to identify the different subcategories of COVID-19 related goods, such as medical devices or personal protective equipment.
| Critical Medical Goods Categories | HTS-10 | Exports HTS Codes (when different) | USITC Category for subset of COVID-19 related goods in the HTS-10 | HTS-10 statistical reporting number description | Example of COVID-19 related product within the HTS-10 |
| Test kits | 3002.15.0000 | COVID-19 test kits/testing instruments | Immunological products, put up in measured doses or in forms or packings for retail sale | Certain diagnostic reagents and test kits | |
| 3821.00.0000 | COVID-19 test kits/testing instruments | Prepared culture media for development of microorganisms | Viral transport medium | ||
| 3822.00.5090 | 3822.00.0000; 3822.00.0002 | COVID-19 test kits/testing instruments | Composite diagnostic or laboratory reagents other than those of heading 3002 or 3006, not elsewhere specified or included | Certain COVID-19 test kits and reagents | |
| 8421.19.0000 | COVID-19 test kits/testing instruments | Centrifuges, including centrifugal dryers, not elsewhere specified or included | Centrifuges | ||
| 8543.10.0000 | COVID-19 test kits/testing instruments | Particle accelerators, not elsewhere specified or included | Particle accelerators | ||
| 9027.50.4015 | 9027.50.5000; 9027.50.9000 | COVID-19 test kits/testing instruments | Other chemical analysis instruments and apparatus using optical radiations | Blood analyzers | |
| 9027.80.2500 | COVID-19 test kits/testing instruments | Nuclear magnetic resonances instruments and apparatus (except those of heading 9018) | COVID-19 diagnostic test instruments and apparatus | ||
| Disinfectants and Sterilization Products | 2207.10.6090 | Disinfectants and sterilization products | Ethyl alcohol, undenatured, of an alcoholic strength by volume of 80 percent volume or higher, for nonbeverage purposes, excluding for fuel use | Alcohol solution (at least 80 percent alcoholic strength) | |
| 2208.90.8000 | NA | Disinfectants and sterilization products | Undenatured ethyl alcohol of an alcoholic strength by volume of less than 80 percent volume, not elsewhere specified or included | Alcohol solution (less than 80 percent alcoholic strength) | |
| 2828.90.0000 | Disinfectants and sterilization products | Hypochlorites, chlorites, and hypobromites, not elsewhere specified or included | Bleach (sodium hypochlorite), non-retail sale | ||
| 2847.00.0000 | Disinfectants and sterilization products | Hydrogen peroxide, whether or not solidified with urea | Hydrogen peroxide in bulk | ||
| 2905.12.0050 | Disinfectants and sterilization products | Propan-2-ol | Isopropyl alcohol | ||
| 3004.90.9210 | Disinfectants and sterilization products | Anti-infective medicaments put up in measured doses or forms or packings for retail sale, not elsewhere specified or included | Chlorhexidine; hydrogen peroxide presented as a medicament; imipenem and cilastatin; lopinavir; oseltamivir; povidone-iodine; remdesivir; ribavirin; ritonavir | ||
| 3402.19.1000 | NA | Disinfectants and sterilization products | Organic surface active agents, other, aromatic or modified aromatic | Wipes (disinfecting or antibacterial), with aromatic or modified aromatic organic surfactants, non-retail sale | |
| 3402.20.1100 | NA | Disinfectants and sterilization products | Preparations containing any aromatic or modified aromatic surface-active agent, put up for retail sale | Wipes (disinfecting or antibacterial), with aromatic or modified surfactants, retail sale | |
| 3402.20.5100 | Disinfectants and sterilization products | Surface-active, washing and cleaning preparations, whether or not containing soap, put up for retail sale, not elsewhere specified or included | Bleach (sodium hypochlorite), retail sale | ||
| 3808.94.1000 | NA | Disinfectants and sterilization products | Disinfectants containing any aromatic or modified aromatic disinfectant | Disinfectants (containing aromatics), including certain disinfecting wipes | |
| 3808.94.5000 | NA | Disinfectants and sterilization products | Disinfectants, not elsewhere specified or included | Disinfectants (other), including certain disinfecting wipes | |
| 3824.99.9295 | 3824.99.9270 | Disinfectants and sterilization products | Chemical products and preparations and residual products of the chemical or allied industries, not elsewhere specified or included | Hand sanitizer | |
| 3824.99.9297 | 3824.99.9270 | Disinfectants and sterilization products | Chemical products and preparations and residual products of the chemical or allied industries, not elsewhere specified or included | Hand sanitizer | |
| 5603.12.0010 | 5603.12.0000 | Disinfectants and sterilization products | Nonwovens, of man-made filaments, weighing more than 25 g/m2 but not more than 70 g/m2, impregnated, coated or covered with material other than or in addition to rubber, plastics, wood pulp or glass fibers; “imitation suede” | Disinfectant wipes | |
| 5603.92.0010 | 5603.92.0000 | Disinfectants and sterilization products | Nonwovens, other than of man-made filaments, weighing more than 25 g/m2 but not more than 70 g/m2, impregnated, coated or covered with material other than or in addition to rubber, plastics, wood pulp or glass fibers; “imitation suede” | Wipes with isopropyl alcohol (e.g., alcohol prep pads) | |
| 8419.20.0010 | 8419.20.0000 | Disinfectants and sterilization products | Medical or surgical sterilizers | Medical or surgical sterilizers | |
| 8419.20.0020 | 8419.20.0000 | Disinfectants and sterilization products | Laboratory sterilizers | Laboratory sterilizers | |
| Ventilators and Oxygenation Products | 9018.19.9550 | Oxygen therapy equipment and pulse oximeters | Electro-diagnostic apparatus, used in medical, surgical, dental or veterinary sciences, not elsewhere specified or included | Fingertip pulse oximeter (for use by medical professionals) | |
| 9018.39.0040 | 9018.39.0030 | Oxygen therapy equipment and pulse oximeters | Bougies, drains and sondes, and parts and accessories | Intubation equipment; parts and accessories | |
| 9018.90.6000 | Oxygen therapy equipment and pulse oximeters | Electro-surgical instruments and appliances and parts and accessories | Extracorporeal membrane oxygenation (ECMO) | ||
| 9019.20.0000 | Oxygen therapy equipment and pulse oximeters | Ozone therapy, oxygen therapy, aerosol therapy, artificial respiration or other therapeutic respiration apparatus; parts and accessories | Medical ventilators (artificial respiration apparatus); extracorporeal membrane oxygenation (ECMO); Continuous Positive Airway Pressure (CPAP) units; bilevel positive airway pressure (BiPap or BPap) units; oxygen concentrators; oxygen humidifiers for oxygen therapy applications; oxygen delivery devices to supply oxygen from the device to the patient; flow splitters | ||
| 9026.80.4000 | 9026.80.0000 | Oxygen therapy equipment and pulse oximeters | Heat meters incorporating liquid supply meters, and anemometers | Flowmeter, Thorpe tube for oxygen 0-15L/min | |
| 9029.20.4080 | 9029.20.5000 | Oxygen therapy equipment and pulse oximeters | Speedometers and tachometers (excluding bicycle speedometers), not for use in civil aircraft | Fingertip pulse oximeters | |
| Personal Protective Equipment (PPE) | 3926.20.1010 | Personal protective equipment | Gloves, seamless, surgical and medical, of plastic | Seamless surgical and medical gloves | |
| 3926.20.1020 | 3926.20.1060 | Personal protective equipment | Gloves, seamless, except surgical and medical, disposable, of plastic | Seamless disposable gloves | |
| 3926.20.9010 | 3926.20.9050 | Personal protective equipment | Aprons, of plastic | Plastic aprons | |
| 3926.20.9050 | Personal protective equipment | Articles of apparel and clothing accessories, of plastic, not elsewhere specified or included | Protective unisex garments, such as medical and surgical gowns; plastic sleeve protectors | ||
| 4015.11.0110 | NA | Personal protective equipment | Surgical gloves, of natural rubber, other than hard rubber | Surgical gloves (natural rubber) | |
| 4015.11.0150 | 4015.11.0000 | Personal protective equipment | Surgical gloves, of vulcanized rubber other than hard rubber, not elsewhere specified or included | Surgical gloves | |
| 4015.19.0510 | NA | Personal protective equipment | Medical gloves, mittens and mitts (except surgical) of natural rubber, other than hard rubber | Medical gloves (natural rubber) | |
| 4015.19.0550 | NA | Personal protective equipment | Medical gloves, of vulcanized rubber other than hard rubber, not elsewhere specified or included | Medical gloves | |
| 4015.19.1010 | 4015.11.0100 | Personal protective equipment | Seamless, disposable gloves, of vulcanized rubber other than hard rubber | Other seamless rubber gloves | |
| 4015.90.0010 | NA | Personal protective equipment | Aprons, of vulcanized rubber other hard rubber | Protective aprons | |
| 4015.90.0050 | 4015.90.0000 | Personal protective equipment | Articles of apparel and clothing accessories, excluding aprons, for all purposes, of vulcanized rubber other than hard rubber, not elsewhere specified or included | Protective unisex garments made of rubber sheeting, textile reinforced rubber or textile backed rubber. | |
| 4818.50.0020 | Personal protective equipment | Articles of apparel and clothing accessories of paper pulp, paper, cellulose wadding or webs of cellulose fibers | Hospital/medical gowns or scrubs | ||
| 4823.90.8600 | NA | Personal protective equipment | Articles of uncoated paper or paperboard or of webs of cellulose fiber, cut to size or shape, not elsewhere specified or included | Paper shoe covers | |
| 6113.00.1012 | 6113.00.0012 | Personal protective equipment | Garments, knitted or crocheted, outer surface impregnated, coated, covered, or laminated with rubber or plastic material, surface completely obscured | Unisex surgical gowns | |
| 6116.10.6500 | 6116.10.0000 | Personal protective equipment | Other gloves, knitted or crocheted, containing less than 50 percent by weight of cotton, man-made fibers or other textile fibers, or any combination thereof, no fourchettes, impregnated | Gloves impregnated or covered with plastics or rubber | |
| 6210.10.2000 | 6210.10.0000 | Personal protective equipment | Garments, made up of fabrics of heading 5602 or 5603: of fabrics formed on a base of paper or covered or lined with paper | Protective garments | |
| 6210.10.5000 | 6210.10.0000 | Personal protective equipment | Garments, made up of fabrics of heading 5602 or 5603: nonwoven disposable apparel designed for use in hospitals, clinics, laboratories and other areas | Disposable garments for use in hospitals, clinics, laboratories, etc. | |
| 6210.10.9010 | 6210.10.0000 | Personal protective equipment | Garments, made up of fabrics of heading 5602 or 5603: coveralls and overalls, not knitted, of impregnated fabric | Protective garments (coveralls and overalls) | |
| 6210.10.9040 | 6210.10.0000 | Personal protective equipment | Garments, made up of fabrics of heading 5602 or 5603: not knit felt and non-woven fabric, except coveralls and overalls, of impregnated fabric | Protective garments | |
| 6210.50.5555 | 6210.50.1000; 6210.50.2000 | Personal protective equipment | Women’s or girls’ not knit man-made fiber other apparel, impregnated fabric not elsewhere specified or included | Unisex surgical gowns | |
| 6211.42.1081 | 6211.42.0000 | Personal protective equipment | Women’s or girls’ other apparel, of cotton, not knitted not elsewhere specified or included | Patient gowns; unisex surgical gowns | |
| 6211.43.1091 | 6211.43.0000 | Personal protective equipment | Women’s or girls’ other apparel, of man-made fibers, not knitted, not elsewhere specified or included | Patient gowns; unisex surgical gowns | |
| 6216.00.5420 | 6216.00.5000 | Personal protective equipment | Gloves, mittens and mitts: of man-made fibers: no fourchettes, sidewalls, less than 36 percent of wool or fine animal hair | Gloves | |
| 6307.90.9889 | 6307.90.9995 | Personal protective equipment | Other made-up articles, not elsewhere specified or included | N95 particulate respirators; other respirators; other textile face-masks, including surgical and disposable masks; shoe covers; textile face masks with plastic face shield | |
| 6505.00.0100 | Personal protective equipment | Hair-nets, any material, whether or not lined or trimmed | Disposable hair nets | ||
| 6505.00.8015 | Personal protective equipment | Nonwoven disposable headgear without peaks or visors of manmade fibers | Disposable headgear | ||
| 6505.00.9089 | 6505.00.8600 | Personal protective equipment | Hats and other headgear, knitted or crocheted, or made up of lace, felt or other textile fabric, in the piece, whether or not lined or trimmed, not elsewhere specified or included | Other headgear | |
| 9004.90.0000 | Personal protective equipment | Spectacles, goggles and the like, corrective, protective, not elsewhere specified or included | Protective goggles | ||
| 9020.00.6000 | 9020.00.8000 | Personal protective equipment | Other breathing appliances and gas masks | Gas masks with mechanical parts or replaceable filters for protection against biological agents; masks incorporating eye protection or facial shields; powered air purifying respirators (PAPRs) | |
| 9020.00.9000 | 9020.00.8000 | Personal protective equipment | Parts and accessories for breathing appliances and gas masks | Parts of gas masks and masks incorporating eye protection or facial shields; parts of powered air purifying respirators (PAPRs) | |
| Gas & Face Masks with Filters | 6307.90.9889 | 6307.90.9995 | Personal protective equipment | Other made-up articles, not elsewhere specified or included | N95 particulate respirators; other respirators; other textile facemasks, including surgical and disposable masks; shoe covers; textile face masks with plastic face shield |
| Pharmaceutical products | 2501.00.0000 | Medicines (Pharmaceuticals) | Salt (including table salt and denatured salt) and pure sodium chloride, whether or not in aqueous solution or containing added anti-caking or free-flowing agents; sea water | Saline solution | |
| 2907.19.8000 | 2907.19.9000 | Medicines (Pharmaceuticals) | Other monophenols | Propofol | |
| 2922.29.2700 | 2922.29.0000; 2922.29.9000 | Medicines (Pharmaceuticals) | Amino-naphthols and other amino-phenols and their derivatives used as drugs | Dobutamine | |
| 2922.50.1300 | NA | Medicines (Pharmaceuticals) | Isoetharine hydrochloride; isoxsuprine hydrochloride; nylidrin hydrochloride; phenylephrine hydrochloride; salbutamol (albuterol); and terbutaline sulfate | Salbutamol (albuterol) | |
| 2923.90.0100 | Medicines (Pharmaceuticals) | Quaternary ammonium salts and hydroxides, whether or not chemically defined, other | Suxamethonium chloride | ||
| 2924.29.6210 | 2924.29 | Medicines (Pharmaceuticals) | Acetaminophen | Acetaminophen (Paracetamol) | |
| 2924.29.6250 | 2924.29 | Medicines (Pharmaceuticals) | Other aromatic cyclic amides and derivatives for use as drugs | Metoclopramide; oseltamivir | |
| 2925.29.2000 | Medicines (Pharmaceuticals) | Aromatic imines and their derivatives; salts thereof, for use as drugs | Chlorhexidine | ||
| 2930.90.9135 | NA | Medicines (Pharmaceuticals) | Other non-aromatic organo-sulfur compounds used as drugs | Cilastatin | |
| 2932.19.5100 | 2932.19.0000; 2932.19.0002 | Medicines (Pharmaceuticals) | Non-aromatic compounds containing an unfused furan ring (whether or not hydrogenated) in the ring | Ranitidine | |
| 2933.29.2000 | 2933.29.0000 | Medicines (Pharmaceuticals) | Aromatic or modified aromatic drugs containing an unfused imidazole ring (whether or not hydrogenated) in the structure | Ondansetron | |
| 2933.33.0000 | Medicines (Pharmaceuticals) | Alfentanil (INN), anileridine (INN), bezitramide (INN), bromazepam (INN), difenoxin (INN), diphenoxylate (INN), dipipanone (INN), fentanyl (INN), ketobemidone (INN), methylphenidate (INN), pentazocine (INN), pethidine (INN), pethidine (INN) intermediate A, phencyclidine (INN) (PCP,PE), phenoperidine (INN), pipradrol (INN), piritramide (INN), propiram (INN) and trimeperidine (INN); salts thereof | Fentanyl | ||
| 2933.39.3100 | NA | Medicines (Pharmaceuticals) | Antidepressants, tranquilizers and other psychotherapeutic agents with an unfused pyridine ring (whether or not hydrogenated) in the structure | Haloperidol | |
| 2933.39.4100 | 2933.39 | Medicines (Pharmaceuticals) | Drugs containing an unfused pyridine ring (whether or not hydrogenated) in the structure, not elsewhere specified or included | Omeprazole; vecuronium bromide; | |
| 2933.49.2600 | 2933.49.2250 | Medicines (Pharmaceuticals) | Drugs containing a quinoline or isoquinoline ring-system (whether or not hydrogenated) not further fused, not elsewhere specified or included | Atracurium besylate (atracurium besilate) | |
| 2933.59.3600 | NA | Medicines (Pharmaceuticals) | Other aromatic or modified aromatic anti-infective agents | Lopinavir | |
| 2933.79.0800 | 2933.79 | Medicines (Pharmaceuticals) | Lactam products described in additional U.S. note 3 to section VI, not elsewhere specified or included | Milrinone | |
| 2933.91.0000 | Medicines (Pharmaceuticals) | Alprazolam(inn), camazepam (inn), chlordiazepoxide (inn), clonazepam (inn), clorazepate & other heterocyclic compounds with nitro atom(s) only | Lorazepam; midazolam | ||
| 2933.99.5300 | Medicines (Pharmaceuticals) | Cardiovascular drugs, not elsewhere specified or included | Levosimendan | ||
| 2934.10.1000 | 2934.10.0000 | Medicines (Pharmaceuticals) | Aromatic or modified aromatic products described in U.S. note 3 to section VI containing an unfused thiazole ring (whether or not hydrogenated) | Ritonavir | |
| 2934.30.2300 | Medicines (Pharmaceuticals) | Antidepressants, tranquilizers and other psychotherapeutic agents | Levomepromazine | ||
| 2934.99.3000 | 2934.99 | Medicines (Pharmaceuticals) | Aromatic or modified aromatic heterocyclic compounds used as drugs, not elsewhere specified or included | Remdesivir | |
| 2934.99.4700 | 2934.99 | Medicines (Pharmaceuticals) | Heterocyclic compounds used as drugs, not elsewhere specified or included | Ribavirin; sulbactam; | |
| 2937.19.0000 | Medicines (Pharmaceuticals) | Polypeptide, protein and glycoprotein hormones, their derivatives and structural analogues, not elsewhere specified or included | Vasopressin/vasopressin injection | ||
| 2937.21.0020 | 2937.21.0000 | Medicines (Pharmaceuticals) | Hydrocortisone | Hydrocortisone | |
| 2937.29.9095 | 2937.29.0000 | Medicines (Pharmaceuticals) | Steroidal hormones, their derivatives and structural analogues, not elsewhere specified or included | Methylprednisolone | |
| 2937.90.0500 | Medicines (Pharmaceuticals) | Epinephrine | Epinephrine | ||
| 2937.90.2000 | 2937.90.1500 | Medicines (Pharmaceuticals) | Catecholamine hormones, their derivatives and structural analogues, not elsewhere specified or included | Norepinephrine | |
| 2939.11.0000 | Medicines (Pharmaceuticals) | Concentrates of poppy straw; buprenorphine (INN); codeine, dihydrocodeine (INN), ethylmorphine, etorphine (INN), heroin, hydrocodone (INN), hydromorphone (INN), morphine, nicomorphine (INN), oxycodone (INN), oxymorphone (INN), pholcodine (INN), thebacon (INN) and thebaine; salts thereof | Codeine; morphine | ||
| 2939.19.5000 | 2939.19.0000 | Medicines (Pharmaceuticals) | Vegetable alkaloids, natural or reproduced by synthesis, and their salts, ethers, esters, and other derivatives, not elsewhere specified or included | Morphine glucuronide | |
| 2939.79.0000 | Medicines (Pharmaceuticals) | Vegetable alkaloids, natural or reproduced by synthesis, their salts and other derivatives, not elsewhere specified or included | Atropine methonitrate; atropine oxide; ipratropium bromide | ||
| 2941.10.1000 | Medicines (Pharmaceuticals) | Ampicillin and its salts | Ampicillin | ||
| 2941.10.5000 | 2941.10.2000; 2941.10.6000 | Medicines (Pharmaceuticals) | Other penicillins and their derivatives with a penicillanic acid structure; salts thereof | Amoxicillin; piperacillin; tazobactam | |
| 2941.30.0000 | Medicines (Pharmaceuticals) | Tetracyclines and their derivatives; salts thereof | Doxycycline | ||
| 2941.90.1050 | 2941.90.6000 | Medicines (Pharmaceuticals) | Natural antibiotics, not elsewhere specified or included | Amphotericin B | |
| 2941.90.3000 | 2941.90.6000 | Medicines (Pharmaceuticals) | Aromatic or modified aromatic antibiotics (excluding natural) | Ceftazidime; vancomycin | |
| 2941.90.5000 | 2941.90.6000 | Medicines (Pharmaceuticals) | Other antibiotics (excluding natural, aromatic or modified aromatic antibiotics) | Amikacin; azithromycin; ceftriaxone; clavulanic acid; meropenem; imipenem | |
| 3001.90.0190 | Medicines (Pharmaceuticals) | Heparin and its salts; other human or animal substances prepared for therapeutic or prophylactic uses, not elsewhere specified or included | Enoxaparin; enoxaparin sodium; heparin sodium | ||
| 3002.13.0000 | Medicines (Pharmaceuticals) | Immunological products, unmixed, not put up in measured doses or in forms or packings for retail sale | Interferon alfa | ||
| 3002.14.0000 | Medicines (Pharmaceuticals) | Immunological products, mixed, not put up in measured doses or in forms or packings for retail sale | Mixed bulk immunologicals (medicines that trigger the immune system) | ||
| 3002.19.0000 | Medicines (Pharmaceuticals) | Blood fractions, not elsewhere specified or included | Other immunologicals (medicines that trigger the immune system) | ||
| 3002.20.0000 | Medicines (Pharmaceuticals) | Vaccines for human medicine | Human vaccines | ||
| 3003.10.0000 | Medicines (Pharmaceuticals) | Medicaments (excluding goods of 3002, 3005, or 3006) containing penicillins or derivatives thereof, or streptomycins or their derivatives | Amoxicillin and clavulanic acid; ampicillin and sulbactam | ||
| 3003.20.0000 | Medicines (Pharmaceuticals) | Medicaments containing other antibiotics (excluding penicillins and streptomycins) | Amikacin; amphotericin B; azithromycin; ceftazidime; ceftriaxone; doxycycline; imipenem and cilastatin; meropenem; piperacillin and tazobactam; vancomycin | ||
| 3003.39.5000 | 3003.39.0000 | Medicines (Pharmaceuticals) | Other medicaments containing hormones or other products of heading 2937 but not containing antibiotics | Epinephrine; hydrocortisone; methylprednisolone; norepinephrine; vasopressin/vasopressin injection | |
| 3003.49.0000 | Medicines (Pharmaceuticals) | Other medicaments containing alkaloids or derivatives thereof | Atropine methonitrate; atropine oxide; codeine; ipratropium bromide; morphine; morphine glucuronide | ||
| 3003.90.0100 | Medicines (Pharmaceuticals) | Other medicaments (excluding goods of heading 3002, 3005 or 3006) consisting of two or more constituents which have been mixed together | Acetaminophen (paracetamol); atracurium besylate (atracurium besilate); chlorhexidine; dobutamine; enoxaparin/enoxaparin sodium; fentanyl; haloperidol; heparin sodium; levomepromazine; levosimendan; lopinavir; lorazepam; metoclopramide; midazolam; milrinone; omeprazole; ondansetron; oseltamivir; povidone-iodine; propofol; ranitidine; remdesivir; ribavirin; ritonavir; salbutamol (albuterol); suxamethonium chloride; vecuronium bromide | ||
| 3004.10.5045 | Medicines (Pharmaceuticals) | Combination antibiotics containing penicillins or derivatives thereof, with a penicillanic acid structure, or streptomycins or their derivatives, not elsewhere specified or included | Amoxicillin and clavulanic acid; ampicillin and sulbactam; piperacillin and tazobactam | ||
| 3004.20.0060 | Medicines (Pharmaceuticals) | Medicaments containing other antibiotics, not elsewhere specified or included | Amikacin; amphotericin B; azithromycin; ceftazidime; ceftriaxone; doxycycline; meropenem; vancomycin | ||
| 3004.32.0000 | Medicines (Pharmaceuticals) | Medicaments containing corticosteroid hormones, their derivatives and structural analogues | Hydrocortisone; methylprednisolone | ||
| 3004.39.0050 | Medicines (Pharmaceuticals) | Medicaments containing hormones or other products of heading 2937 but not containing antibiotics, not elsewhere specified or included | Epinephrine; Norepinephrine; vasopressin/vasopressin injection | ||
| 3004.49.0020 | Medicines (Pharmaceuticals) | Anticonvulsants, hypnotics and sedatives, in measured doses or in forms or packaging for retail sale | Morphine glucuronide | ||
| 3004.49.0040 | Medicines (Pharmaceuticals) | Other medicaments primarily affecting the central nervous system, not elsewhere specified or included | Atropine methonitrate; atropine oxide; codeine; fentanyl; morphine | ||
| 3004.90.9220 | Medicines (Pharmaceuticals) | Cardiovascular medicaments put up in measured doses or in forms for retail sale | Dobutamine; enoxaparin; enoxaparin sodium; levosimendan; milrinone | ||
| 3004.90.9228 | 3004.90.9225 | Medicines (Pharmaceuticals) | Analgesics, antipyretics and nonhormonal anti-inflammatory agents, not elsewhere specified or included | Acetaminophen (paracetamol) | |
| 3004.90.9230 | Medicines (Pharmaceuticals) | Anticonvulsants, hypnotics and sedatives, primarily affecting central nervous system, put up in measured doses or in forms or packings for retail sale | Midazolam; propofol | ||
| 3004.90.9235 | Medicines (Pharmaceuticals) | Antidepressants, tranquilizers and other psychotherapeutic agents, primarily affecting the central nervous system, put up in measured doses or in forms or packings for retail sale | Haloperidol; levomepromazine; lorazepam; | ||
| 3004.90.9240 | Medicines (Pharmaceuticals) | Medicaments primarily affecting the central nervous system, put up in measured doses or in forms or packings for retail sale, not elsewhere specified or included | Atracurium besylate (atracurium besilate); suxamethonium chloride; vecuronium bromide | ||
| 3004.90.9260 | Medicines (Pharmaceuticals) | Medicaments primarily affecting the digestive system put up in measured doses or in forms or packings for retail sale, not elsewhere specified or included | Metoclopramide; omeprazole; ondansetron; ranitidine | ||
| 3004.90.9270 | Medicines (Pharmaceuticals) | Medicaments primarily affecting electrolytic, caloric or water balance, put up in measured doses or in forms or packing for retail sale, not elsewhere specified or included | Ringer´s lactate; saline solution | ||
| 3004.90.9285 | Medicines (Pharmaceuticals) | Medicaments primarily affecting the eyes, ears or respiratory system, put up in measured doses or in forms or packings for retail sale, not elsewhere specified or included | Ipratropium bromide; salbutamol (albuterol) | ||
| 3004.90.9290 | Medicines (Pharmaceuticals) | Medicaments consisting of mixed/unmixed products put up in measured doses or in forms or packings for retail sale, not elsewhere specified or included | Heparin sodium; saline solution | ||
| 3905.99.8000 | Medicines (Pharmaceuticals) | Other vinyl polymers in primary forms, not elsewhere specified or included | Povidone-iodine |
*Sometimes multiple product categories are found under one 6-digit HS code; in such circumstances, the 6-digit HS code has been measured once for both products.
With respect to pharmaceuticals, we used a broader selection of goods to show that the U.S. problematic overconcentration of sources of imports of medical drugs does not limit to COVID-19 related medicines. The table bellow contains the HTS codes used:
| Medicine Categories | HTS Codes |
| All Finished Medicines | 3003, 3004 |
| Finished Medicines Sold for Retail in Measured Doses | 3004.90 |
| Sulfonamides (Antibacterials) | 3004.90.6005, 3004.90.9105, 3004.90.9205 |
| Anti-Infective Medicines | 3004.90.9210, 3004.90.9110, 3004.90.6010 |
| Cardiovascular Medicines | 3004.90.9220, 3004.90.9120, 3004.90.6020 |
| Anti-Inflammatories & Painkillers | 3004.90.6022, 3004.90.6024, 3004.90.6026, 3004.90.6028, 3004.90.9022, 3004.90.9024, 3004.90.9026, 3004.90.9028, 3004.90.9122, 3004.90.9124, 30049.09.126, 3004.90.9128, 3004.90.9222, 3004.90.9224, 3004.90.9226, 3004.90.9228 |
| Sedatives | 3004.90.6030, 3004.90.9230 |
| Diuretics | 3004.90.9265, 3004.90.6065, 3004.90.9165 |
| Cough and Cold Medicines | 3004.90.9176, 1704.9025, 3004.90.3000, 2106.90.39, 3004.90.6075, 3004.90.9276 |
| Medicines Affecting Respiratory System, Eyes and Ears | 3004.90.9185, 3004.90.9285 |
| Antibiotics | 3003.20, 3004.20 |
We are unsure why Jordan has such a significant share of antibiotic exports to the U.S., but it may be explained by U.S. Agency for International Development (USAID) assistance to Jordan’s antibiotic sector as well as benefits conferred upon Jordan from the U.S.-Jordan Free Trade Agreement. Ireland’s outsized role as the top import source for U.S. respiratory, ear, and eye medicine may be explained by actual production capacity in Ireland for these goods. Usually, Ireland ranks as a top import source by value, but not by volume. While the volume data set represents the amount of medicine that actually is sent to the United States, the value data set reflects the high prices of some medicines protected by monopoly patents as well as pharmaceutical corporations’ tax-avoidance strategies. This includes some firms’ corporate “inversions,” which are when firms relocate their legal “home” to countries with low tax rates and then charge their legal entities in their old base countries’ large patent-licensing fees, which then can be deducted from taxes as a business expense. Nevertheless, Ireland seems to actually be a significant volume producer of ear, eye, and respiratory medicine. It is unclear which subcategory Ireland exports to the U.S. as the tariff lines cannot be more specific. Finally, Mexico appears to have an outsized rank as the second largest import source by volume for all finished medicines.